12 DeFi Valuation Metrics Every Crypto Investor Must Know

 Identify indicators that are universal or applicable to specific types of DeFi, as well as some key ratios to consider when researching new DeFi protocols.
This article is sourced from Bankless, originally titled "Token metrics you should know," authored by Lucas Campbell, and translated by Mint Ventures Xu Xiaopeng.
The original text by Lucas Campbell was published in March 2021, so the data mentioned by the author is also from that time. To avoid affecting the author's original intent, this data has not been updated.
1. Universal Valuation Metrics
We have previously mentioned that DeFi is accelerating a financial system that has been in operation for thousands of years. We are learning how to transform traditional valuation methods and apply them to this new paradigm of DeFi.
After years of learning, we now have a deeper understanding of how DeFi protocols operate and how they create value. More importantly, we now have tools to analyze them, as well as new valuation metrics (just like traditional asset valuation metrics).
Therefore, today we will take some time to outline those metrics that are universal or applicable to specific types of DeFi, as well as some key ratios to consider when researching new DeFi protocols.
Here are the metrics you should keep in mind:
1) Market Cap vs. Fully Diluted Valuation (FDV)
Editor’s note: FDV stands for Fully Diluted Valuation.
Understanding the difference between a protocol's market cap and its fully diluted market cap (FDV) — the total market cap when all tokens are in circulation — is very valuable for those looking to hold project tokens long-term.
If there is a significant difference between the protocol's market cap and its FDV, it indicates that a large number of tokens have yet to enter circulation. Therefore, investors should recognize that as these new tokens enter the market, there may be considerable inflationary sell pressure.
This is especially true for newly launched protocols, where the circulating supply often constitutes only a small portion of the total supply. Do you remember when Curve first launched CRV, and the token traded as high as $15-20, while the protocol's FDV exceeded $50 billion? This was higher than Ethereum's market cap at that time.
Recognizing the difference between the two can help you avoid significant losses, as the valuation at that time was unreasonable. Indeed, the market later corrected it towards a more reasonable valuation. The key point is to understand the supply schedule of the underlying asset and how to factor it into the current valuation, which is very helpful for holding long-term positions (especially for newly launched protocols)!
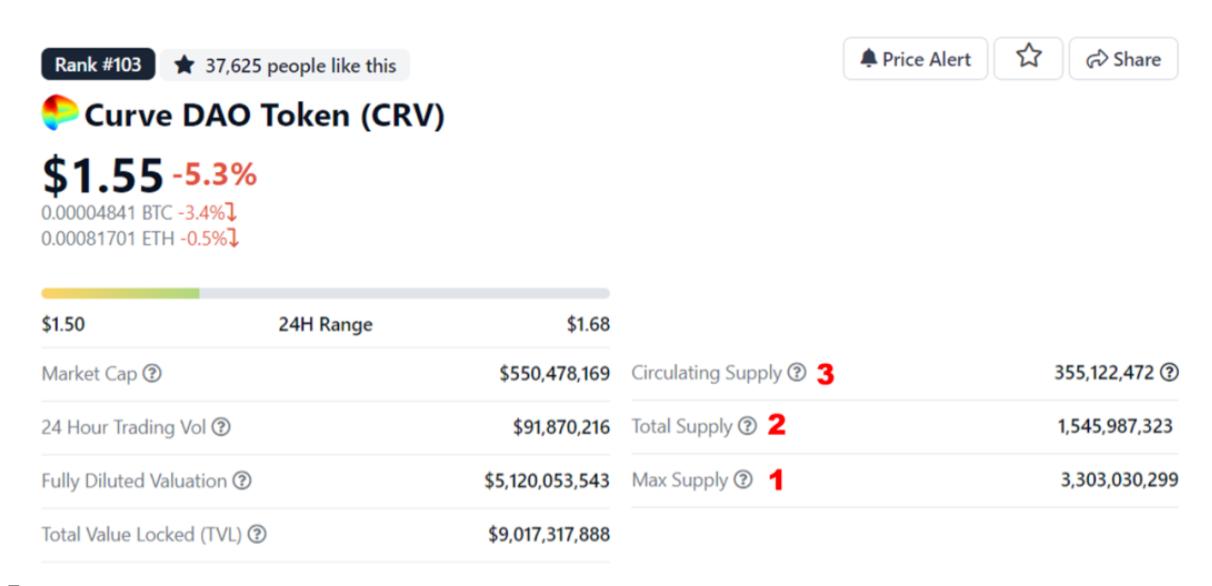
Editor’s note: When understanding a project or reading an article, we often encounter the concept of three token supplies, and we should be careful to distinguish which supply corresponds to the market cap when someone talks about a project's market cap.
The three supply concepts are:
Maximum Supply: The total amount of tokens that will ever be released, and the market cap corresponding to this supply is what the author refers to as FDV;
Total Supply: The total amount of tokens currently released, including those in free circulation and those locked in various mechanisms;
Circulating Supply: The number of tokens currently in free circulation in the market.
In the case of the Curve project, the number 1 in the image below refers to the maximum supply, number 2 refers to the actual supply currently released through mining and various outputs, and number 3 refers to the portion of the actual supply that is not locked and is in free circulation.
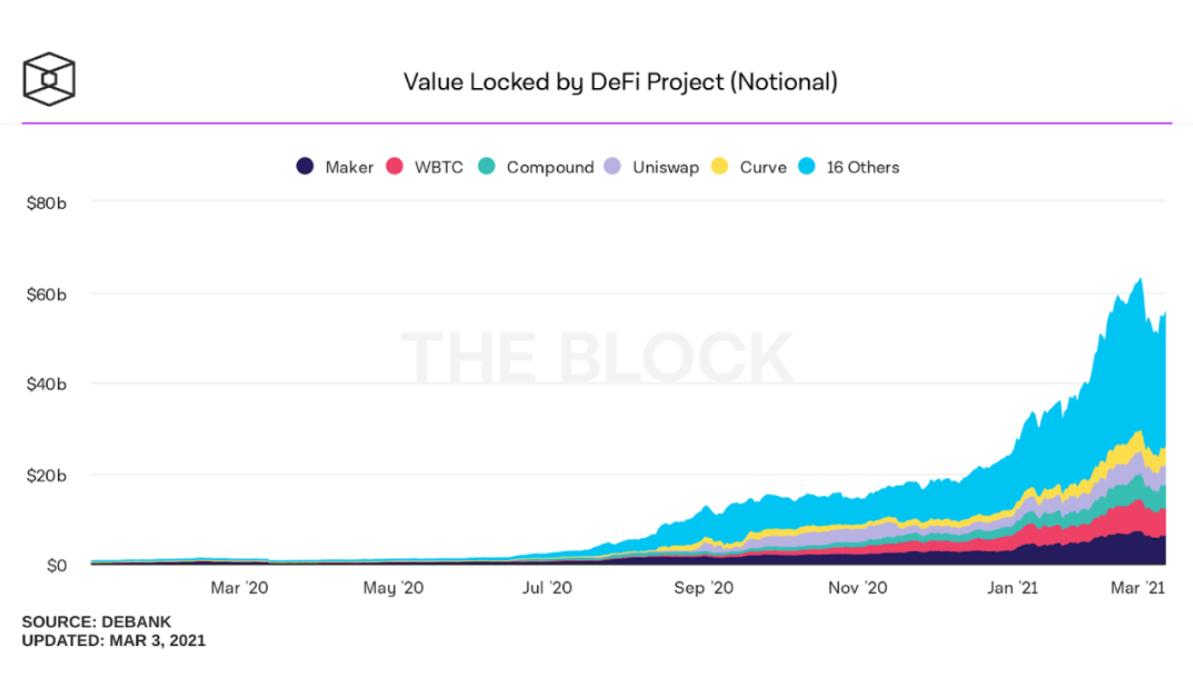
2) Total Value Locked (TVL)
Editor’s note: TVL stands for Total Value Locked.
TVL is one of the most well-known metrics in DeFi. It represents the total amount of assets held by each protocol — some may consider it as the protocol's assets under management (AUM). Generally, the more value locked in a protocol, the better.
This means that people are willing to lock their funds in the protocol, to some extent trusting it, in exchange for the various values it provides (such as earning yields, providing liquidity, or serving as collateral).
We need to recognize that with the introduction of yield farming, this metric has become very nuanced, including "incentivized" TVL and "non-incentivized" TVL. A protocol with $1 billion in non-incentivized TVL may better reflect the genuine demand for its services than another protocol with $1 billion that has been boosted by high mining rewards.
A perfect example is Uniswap vs. Sushiswap.
Both protocols currently have similar TVLs, at $3.7B (Uniswap) and $3.4B (Sushiswap).
The key difference is that the value locked in Uniswap is not incentivized — all of it is native. In contrast, most of Sushiswap's liquidity is incentivized by a large number of SUSHI tokens.
This does not mean that one project is necessarily better than the other, but it is a point to be reminded of. Therefore, when you consider TVL as a valuation metric, be sure to understand how much of it is incentivized and how much is not.
Editor’s note: While understanding the author's point, we should also realize that although Uniswap does not provide liquidity provider token incentives, it has made concessions in fee collection — giving 100% of the 0.3% fee to market makers, while Sushi takes 1/6 of that. The concession in fees is essentially a form of subsidy.
3) Revenue
The revenue of a protocol equals the total fees paid to the liquidity providers of the protocol. For AMMs, this may be the total fees paid to market makers; for lending protocols, it may be the total interest paid by borrowers. It can essentially be understood as the amount users are willing to pay for using the protocol.
This is why revenue is such an important metric — it reflects the willingness of people to pay the protocol for its services in concrete monetary terms (for example, the willingness to conduct simple, fast, 24/7 transactions between any ERC20 tokens).
4) Protocol Earnings
While revenue is the amount users are willing to pay to the protocol, primarily earned by liquidity providers offering the basic service, protocol earnings refer to the actual income earned by the tokens, which is the core of the protocol — profit.
In other words, just like early-stage startups and growth companies do not pay dividends to shareholders, not every protocol will distribute cash flow to token holders (because at that time, token holders may not be able to effectively utilize the capital).
Uniswap and Sushiswap are examples we often cite. Although Uniswap is the clear leader in DeFi in terms of generated revenue, UNI token holders have not received any cash flow. In contrast, Sushiswap chooses to directly distribute about 16% of the revenue generated (0.05% of the 0.30% fee) to xSUSHI stakers.
5) Price-to-Sales Ratio: PS
The price-to-sales ratio (P/S) compares the market cap of the protocol to its revenue. For loyal Bankless readers, most may be familiar with this metric. It can serve as a reliable benchmark because it compares market cap with revenue (i.e., the usage of the protocol). In traditional finance, the price-to-sales ratio is a fundamental metric for measuring the amount of revenue generated by a company and its expected future growth.
Essentially, the price-to-sales ratio indicates how much the market is willing to pay X dollars for every dollar of revenue generated. Interestingly, the P/S ratio may mean different things across different protocols. Here are some examples:
DEX: The market is willing to pay X dollars for every dollar of trading fees earned.
Lending Protocol: The market is willing to pay X dollars for every dollar of interest paid by borrowers.
Yield Protocol: The market is willing to pay X dollars for every dollar of yield generated by LPs.
Therefore, P/S is not the best metric for cross-industry comparisons, as it may have nuances, but it is a valuable ratio when comparing similar protocols!
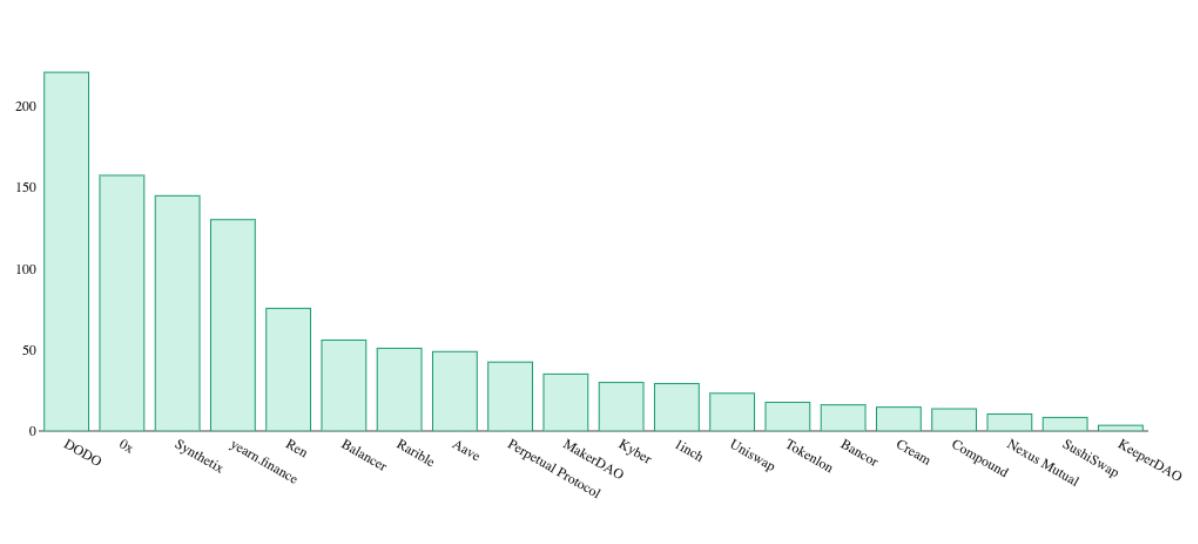
Price-to-sales ratios of major DeFi protocols. Source: Token Terminal
6) Price-to-Earnings Ratio: PE
Since many DeFi protocols are in the early stages of development, it is common for token holders not to have direct cash flow — similar to the traditional world. However, as the industry matures and more protocols allocate dividends to their token holders, the price-to-earnings ratio will become increasingly important.
There are already some protocols — such as Maker, Sushiswap, Kyber, etc. — that can provide direct cash flow to token holders. Below is a simple calculation of the price-to-earnings ratios of certain DeFi protocols based on revenue data from Token Terminal and potential profit models.
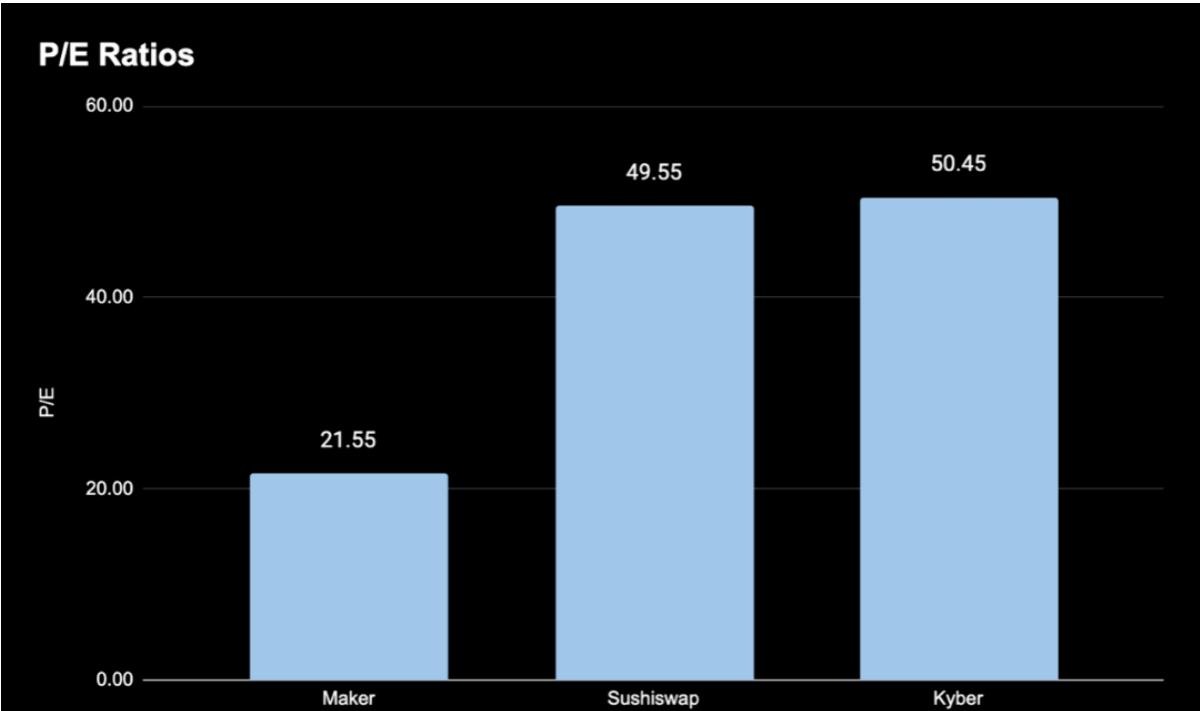
Price-to-earnings ratios of major protocols with profits for token holders. Source: Token Terminal
7) Revenue to Locked Value Ratio
The ratio of revenue to total locked value can serve as an interesting metric to understand the efficiency with which a protocol generates revenue from its locked capital. As a reference, we calculate this metric by dividing annual revenue by locked value.
Similar to the above ratios, this literally means: "The protocol can generate X dollars from every dollar locked (within a year)."
The closer "X" is to 1, the more efficiently the protocol earns fees from the underlying capital, which may indicate better investment value compared to similar protocols. For example, we calculated the revenue to locked value ratio for the top 5 protocols ranked by locked value using data from Token Terminal and DeFi Pulse.
Uniswap leads by a wide margin, as the protocol can generate $0.35 in revenue for every dollar of locked value (annually) — if you ask me, this efficiency is very high!
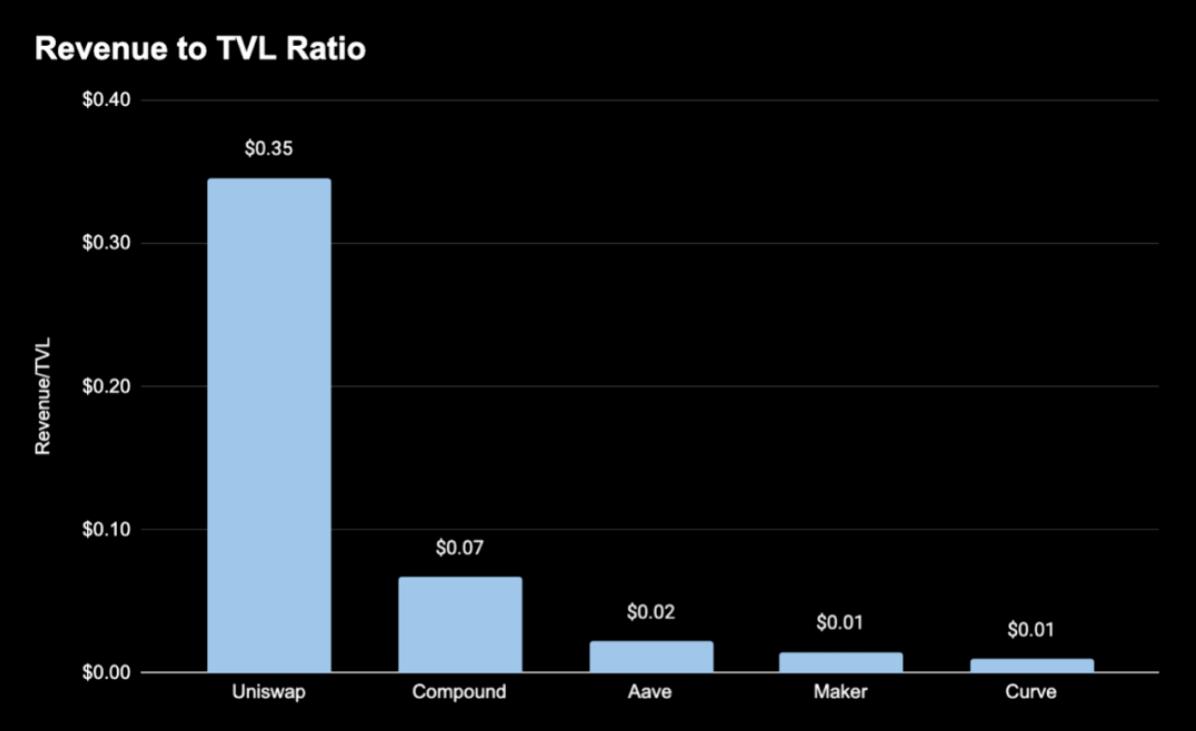
Revenue to locked value ratios of the top 5 DeFi protocols by locked value. Source: Token Terminal
Editor’s note: The revenue to locked value ratio can also be referred to as the net capital income rate, which essentially measures the efficiency with which the protocol's locked funds generate income for the protocol and liquidity providers. While marveling at Uniswap's performance in this metric far exceeding that of three lending/monetary protocols and Curve, we need to note that providing liquidity in Uniswap faces the risk of impermanent loss, whereas providing liquidity in lending protocols or Curve generally does not carry such risks. Uniswap's higher capital income rate is essentially a result of the balance between risk and reward.
2. Industry-Specific Valuation Metrics
Industry-specific metrics are fundamental measures of whether a protocol is achieving its intended goals. What is the trading volume of a DEX? How much capital has been borrowed in a lending protocol? Has anyone minted synthetic assets?
These are key questions you should ask when researching the feasibility and usage data of each protocol. Here are some metrics you should remember.
1) Decentralized Exchanges
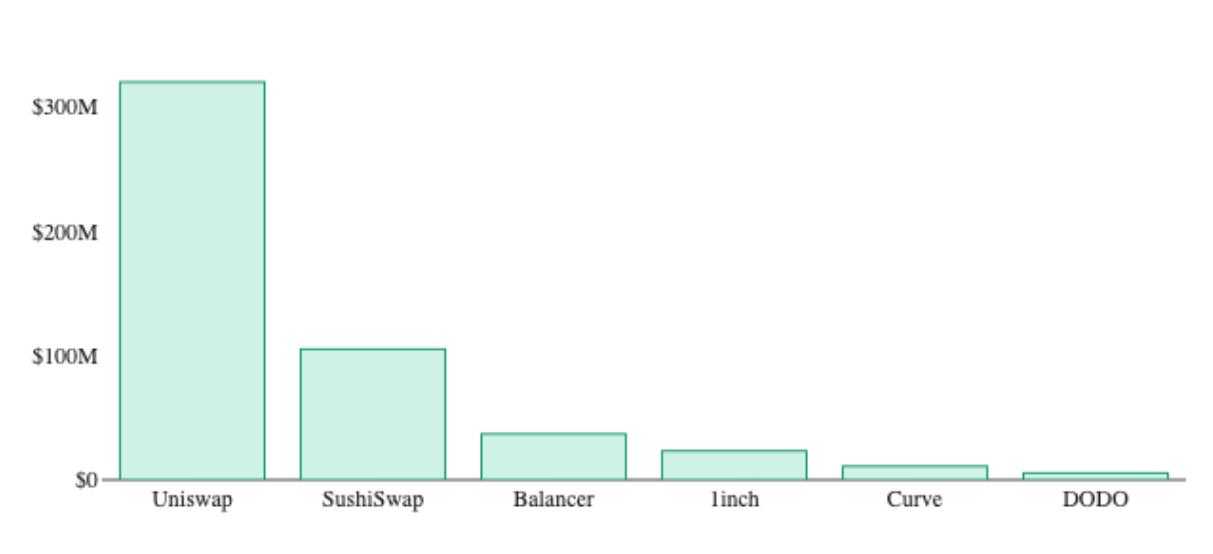
a. Trading Volume
Naturally, one of the most basic metrics for measuring the success of a liquidity protocol is the total volume of trades it facilitates. Higher trading volumes translate to more cash flow for protocol participants, including liquidity providers and token holders (if there is a cash flow capture mechanism).
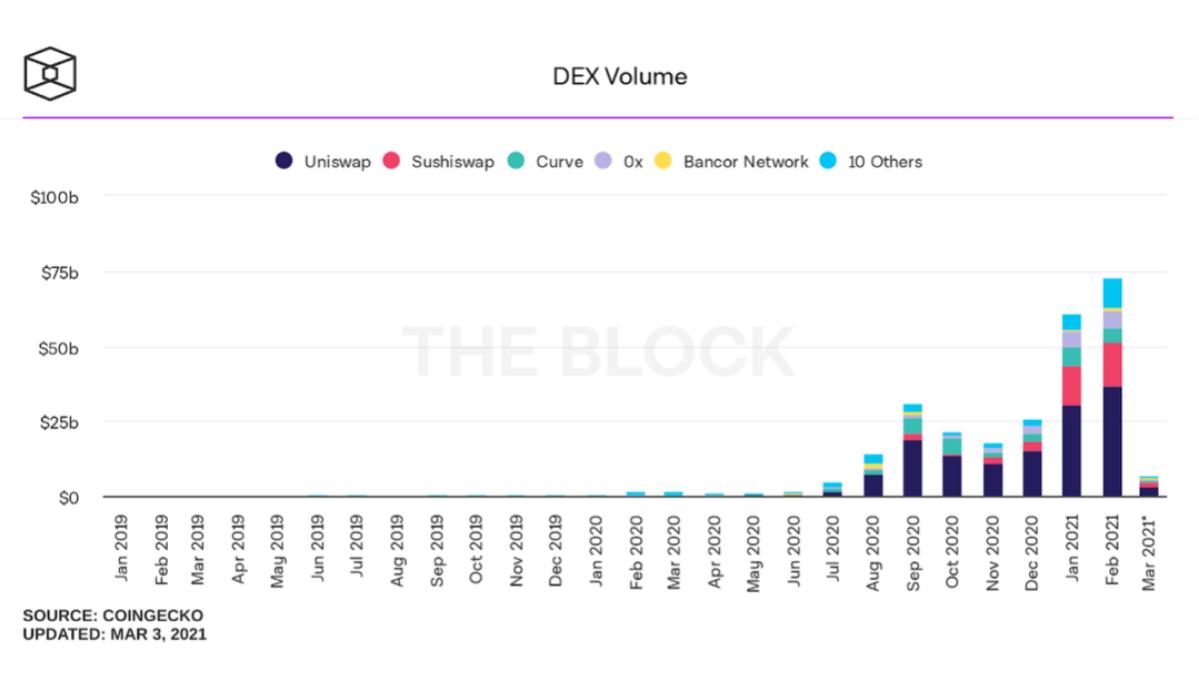
Monthly trading volume of DEXs. Source: The Block
b. Price-to-Volume Ratio (P/V)
The price-to-volume ratio (P/V) is a DEX-specific valuation metric that has similar properties to the price-to-earnings ratio. We discussed this in the article "The Battle of DEX Leaders: Uniswap vs. Sushiswap." The P/V ratio is calculated by dividing the protocol's fully diluted valuation (FDV) by the daily trading volume of the exchange.
The reason for using this ratio is that if we evaluate these liquidity protocols based on the amount of revenue they generate, it becomes complicated when comparing protocols with different fee structures. The P/V ratio can apply to all protocols and helps us understand the current valuation levels assigned to each protocol based on trading volume.
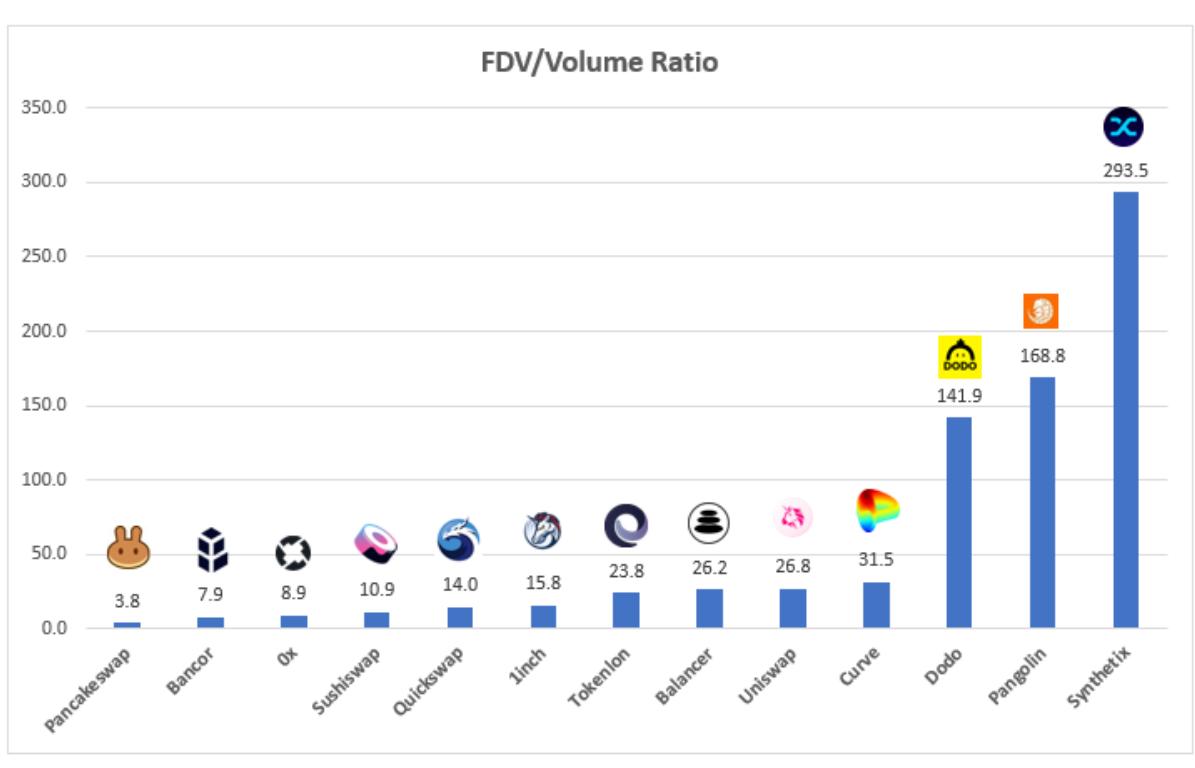
Price-to-volume ratios of mainstream DEXs. Source: Andrew Kang
2) Lending Protocols
a. Daily Net Borrowing
For interest rate protocols like Compound, Aave, and Cream, the total outstanding debt and deposit utilization rate indicate the demand from users to borrow from the protocol.
This is a key element of interest rate protocols: it initiates a business flywheel. The higher the borrowing demand, the higher the interest rates for depositors, which drives depositors to add more liquidity, thereby increasing the borrowing demand for the protocol.
In short, more borrowing demand means higher deposit interest rates, which is key to attracting funds to the protocol.
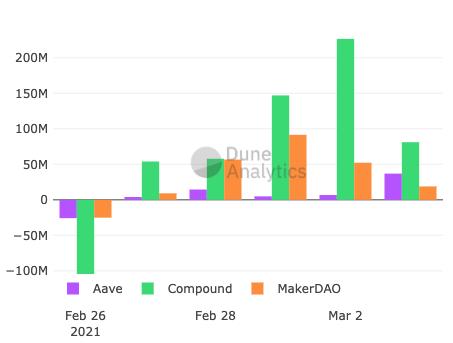
Net borrowing of Aave, Compound, and Maker. Source: Dune Analytics
3) Derivatives
a. Outstanding Debt/Synthetic Assets Total
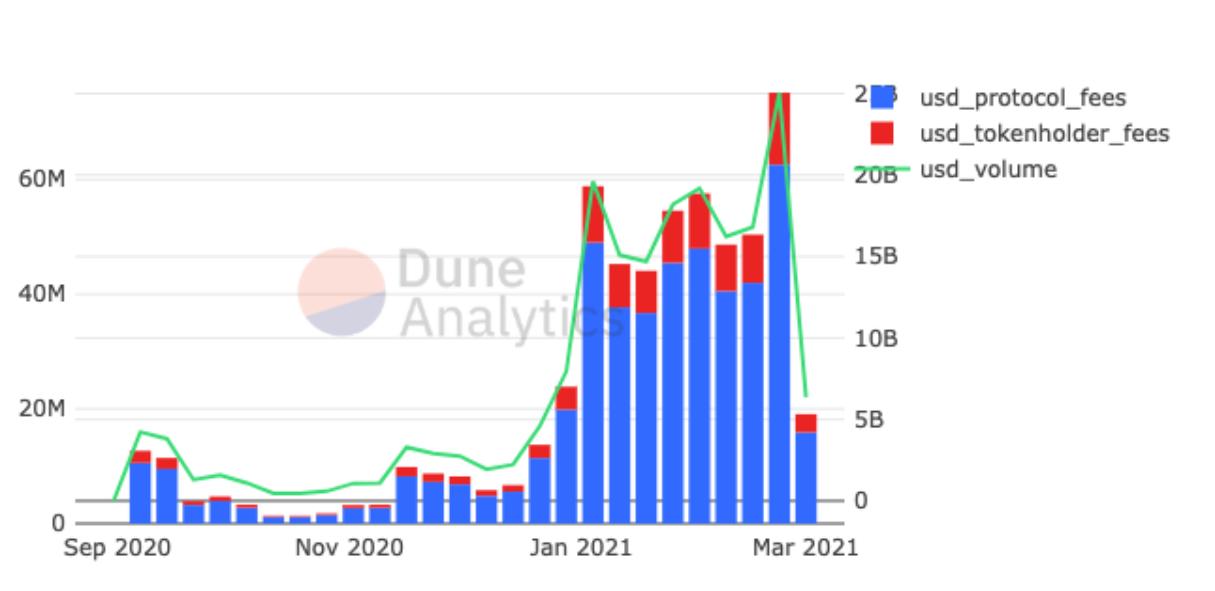
The outstanding debt or synthetic assets of derivative protocols like Synthetix and Maker is one of the key drivers behind revenue and protocol earnings.
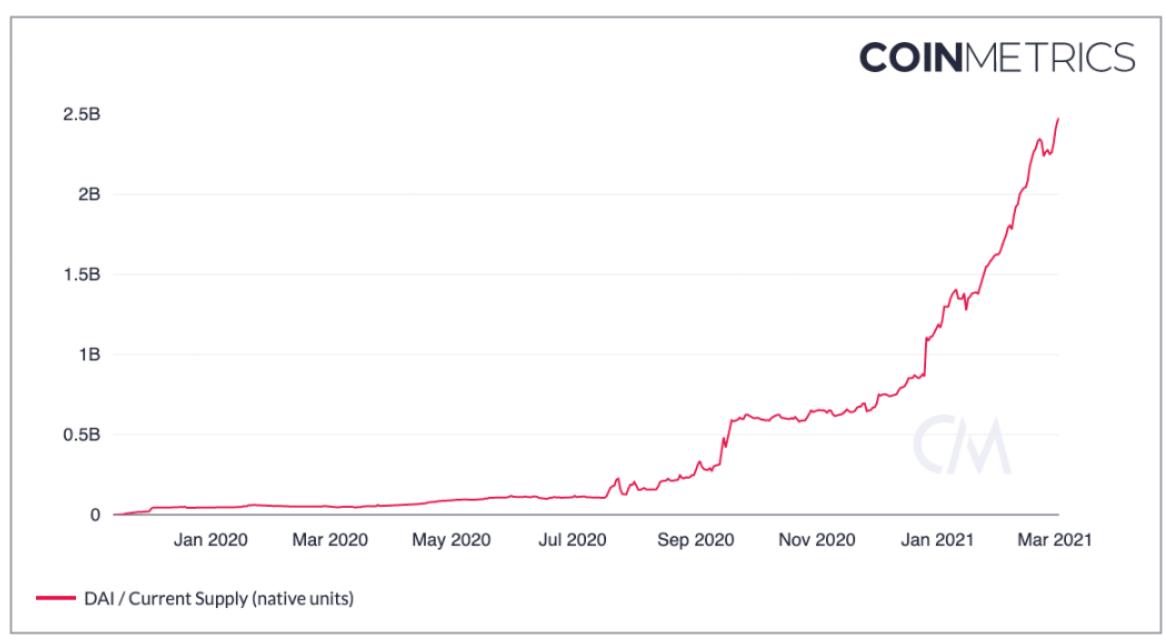
Total outstanding debt of Dai. Source: Coinmetrics
The more outstanding debt there is, the more capital the protocol has available for minting, and the more cash flow allocated to token holders. Ultimately, outstanding debt is a key indicator of the demand for synthetic assets in the protocol (i.e., Maker's Dai, Synthetix's Synths, etc.).
4) Insurance
a. Active Cover Amount
The active cover amount of insurance protocols like Nexus Mutual and Cover is a foundational metric for the industry.
In simple terms, it shows the market's demand for the protocol's "insurance policies." The higher the active cover amount, the more policies sold, which means the more premiums (i.e., revenue) the protocol collects. This is very directly related to Nexus Mutual, as its token NXM is priced based on a bond curve driven by the total amount of funds in the pool. The larger the active cover amount, the more premiums the capital pool earns, which drives the bond curve of Nexus Mutual upward.
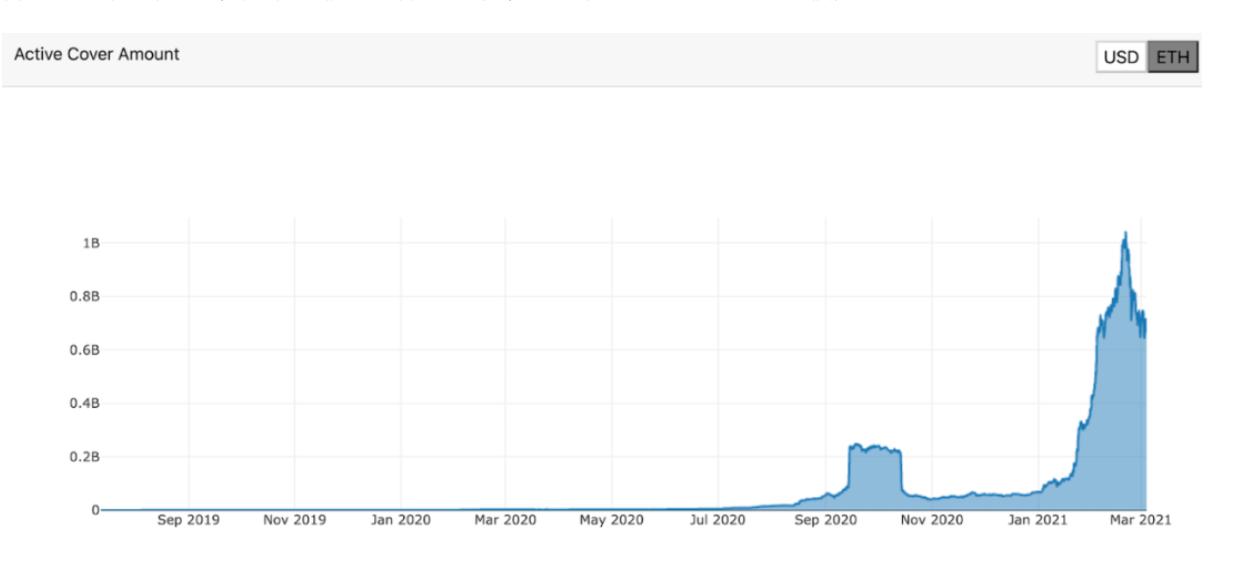
Total effective insurance amount of Nexus Mutual. Source: Nexus Tracker
3. Conclusion
There are many ways to analyze a protocol today. Fortunately, DeFi has evolved into a diverse ecosystem that allows you to compare them against each other and see the results.
That said, many qualitative dimensions are not reflected in the data, and these aspects are equally important, if not more so. These may include the team's capabilities, new products being developed, and most importantly: the level of narrative surrounding the project.
Like traditional finance, fundamental valuation metrics have largely been discarded.
Value investing is outdated. The entire market is now driven by narratives. The market no longer prices assets based on revenue multiples or price-to-earnings ratios — they value them based on the company's narrative (some might call it "memes").
This absolutely applies to cryptocurrencies as well. If NFTs are hot right now, then NFT token projects will succeed. It's that simple — no analysis needed.
However, fundamental valuation metrics can help you conduct quick checks, especially when you dive deep into similar protocols. If a project enters the market with a fully diluted valuation of $50 billion, exceeding the market cap of its underlying blockchain layer, then it may not be a good time to invest; the market's expectations for it may already be too high.
Ultimately, we must recognize that the cryptocurrency market is still young, pricing efficiency is low, and it is prone to madness and irrational activities that detach from fundamentals.
In any case, the fundamental valuation metrics summarized above can serve as reliable references, providing solid data support for your investment views.
Editor’s note: Although the author makes some "mockery" of the value investing philosophy at the end, we still believe that to successfully invest in and fully enjoy the value dividends of a crypto project, both qualitative observation and quantitative analysis are indispensable. This aligns with the ultimate pursuit of value investing: to buy good companies/projects at good prices.
Qualitative observation addresses whether the project is a good one, while quantitative analysis addresses what price is suitable for entry. Specifically, qualitative dimensions include the project's track and business model, token economic model, moat, and market competition landscape. These dimensions, combined with market trends, form the project's "narrative." Other qualitative factors to consider include the project's team (very important), partners, and industry resources, among others. Quantitative analysis can assist decision-making through various metrics, or even develop your own exclusive metrics.
 Risk warning
 Risk warning