Viewpoint: The best valuation method for public chain tokens should not refer to "company stocks," but rather to the currency of "sovereign economies."

 When valuing L1 tokens, the currency exchange rate model is more useful than the stock dividend model.
Author: Tascha Che, Founder of mysoundwise.com, PhD in Macroeconomics
Compiled by: Perry Wang, Chain News
1/ Many people try to value Layer 1 (L1) tokens like stocks.
This is absurd.
Do not price Ethereum, Solana, and others like "companies," but rather like "countries."
That's it.
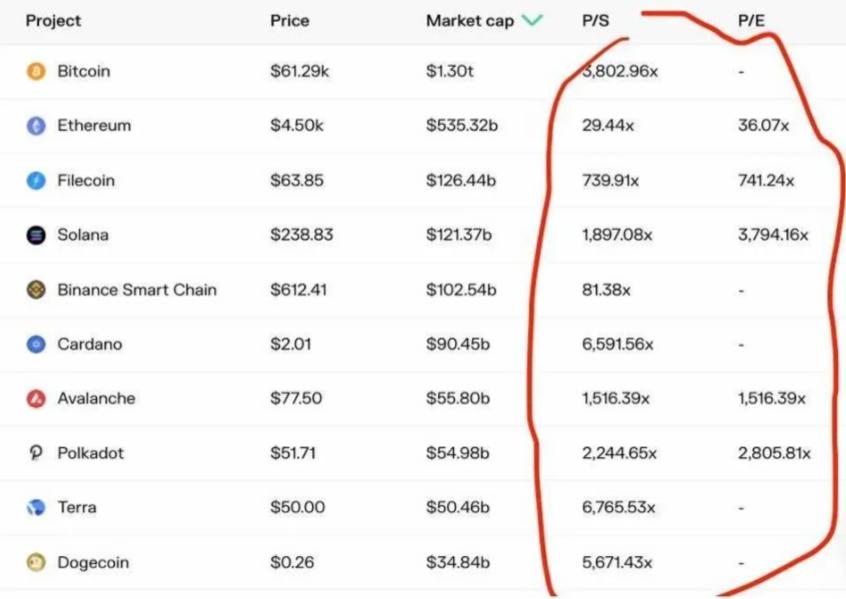
2/ The first erroneous method for evaluating L1 tokens: earnings multiples.
Some people apply the value investment framework of stocks to blockchain, proposing concepts like price-to-earnings ratios and price-to-sales ratios around ETH, SOL, AVAX, etc.
3/ Unsurprisingly, these ratios look astonishingly high. High enough to give any value investor a heart attack.
4/ This is the problem. Earnings are the ultimate goal of company value. But they do not apply to calculating the value of public chains.
5/ If Ethereum were to halve its average gas fees tomorrow, similar earnings-related factors would double. Does this mean Ethereum was previously overvalued by a factor of two? No. On the contrary, it would be a boon for platform growth.
6/ The value of a blockchain comes from how much economic activity token holders support, regardless of what percentage of that activity the platform pockets as "profit."
7/ If you view public chains as sovereign economic ecosystems similar to countries, the absurdity of valuation ratios becomes evident.
If the U.S. were to double all tax rates, the "price-to-earnings ratio" of the U.S. government would drop by half. But would that be good for the U.S. economy? Hardly.
8/ Structurally, in some countries, the share of government activity in the total economy is higher than in others. Other things being equal, China (with a relatively high proportion of state-owned assets) would have a lower price-to-earnings ratio than the U.S. (with a relatively low proportion of state-owned assets). Does this really explain the economic value of these two economies? It makes no sense.
9/ The second erroneous method for valuing L1 tokens: discounted cash flow (DCF). DCF is another commonly borrowed framework from stock valuation, which is actually even more absurd.
10/ The DCF model for stocks looks like this:
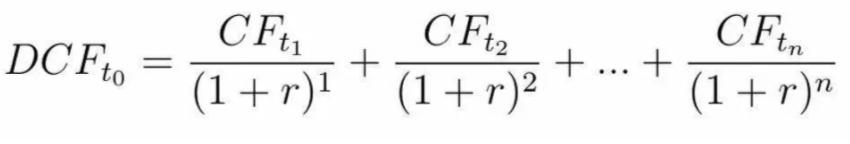
11/ This is a good method because the future cash flows of a company are denominated in the same currency as its stock price, such as dollars.
12/ However, the future cash flows of Solana and Ethereum are denominated in SOL and ETH, not dollars. Therefore, you need to make assumptions about the exchange rate for each future period to arrive at a DCF in dollars.
The DCF model for Solana looks like this:
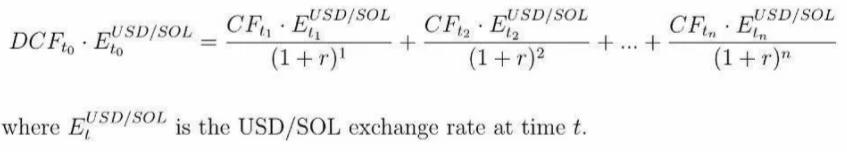
13/ This is completely useless because you first need to calculate the USD/SOL exchange rate.
Valuing L1 tokens should not use company valuation models, but rather treat L1 tokens as the currency of a "cryptocurrency nation."
14/ L1 tokens are a new type of asset. They are a kind of stock, a kind of bond, a kind of currency. But the larger the blockchain platform, the more it resembles a sovereign economy, and its native token is a true currency.
15/ Therefore, when valuing L1 tokens, a currency exchange rate model is more useful than a stock dividend model.
16/ Unfortunately, when you try to estimate exchange rates, it's like poking a hornet's nest. There are a million factors that affect the relative prices of different currencies, and hundreds of frameworks and assumptions; the specific estimation process could fill a library.
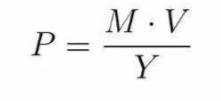
17/ But there is still a simple and elegant framework—arguably the closest to "fundamental analysis"—which is the quantitative model of currency.
The specific formula is:
Money Supply (M) · Velocity of Money (V) = Price (P) · Real GDP (Y)
Rearranging the equation, you can express the price level as:
18/ What does this have to do with exchange rates?
19/ Assuming the outputs of any two economies are substitutable, price differences can be arbitraged (which is obviously not the case in many situations, but as long as the direction is correct, it won't affect our purpose), the relationship between the price levels of currency A and currency B is:
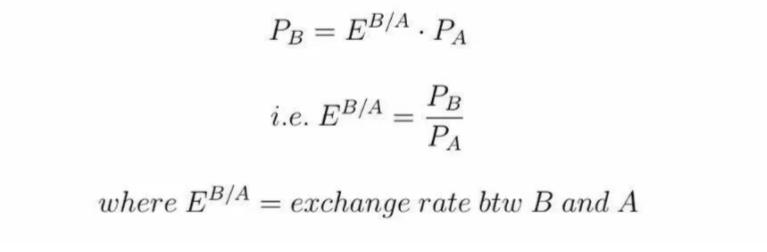
20/ A simple example: a hamburger sells for 1 euro in Germany and 1.5 dollars in the U.S., so the dollar/euro exchange rate = 1.5.
Substituting this equation back into the previous domestic price level equation, you get:
21/ If it's still unclear, assume
Country A = the United States
Country B = Ethereum,
You get:

22/ This means that the exchange rate of ETH against the dollar appreciates under the following conditions:
Ethereum GDP (YETH) grows faster than U.S. GDP (YUS)
The growth rate of U.S. money supply (MUS) exceeds that of Ethereum money supply (METH)
The growth rate of dollar velocity of money (VUS) exceeds that of ETH velocity of money (VETH)
23/ If you calculate this equation at face value, the growth rate of ETH price in dollars should have a 1:1 relationship with the growth rate of U.S. money supply. Since last year, the massive expansion of the Federal Reserve's balance sheet has been evidenced by changes in ETH prices.
24/ But that's not the most interesting part.
Interestingly, the growth rate of ETH prices and the growth rate of Ethereum GDP (i.e., the total output of the Ethereum economy) should also have a 1:1 relationship.
25/ Obviously, there is no statistical bureau compiling "GDP" for the "Ethereum nation." However, GDP growth can be indirectly inferred from the growth rates of transactions, wallets, total locked value (TVL), etc.
26/ Almost every transaction involves some additional economic output. The growth of wallets can be seen as an increase in the "working population" of that country. The growth of TVL reflects the growth of the financial sector in the economy.
27/ Of course, these are not perfect measures. But the key is that they are positively correlated with the additional economic output generated on the platform.
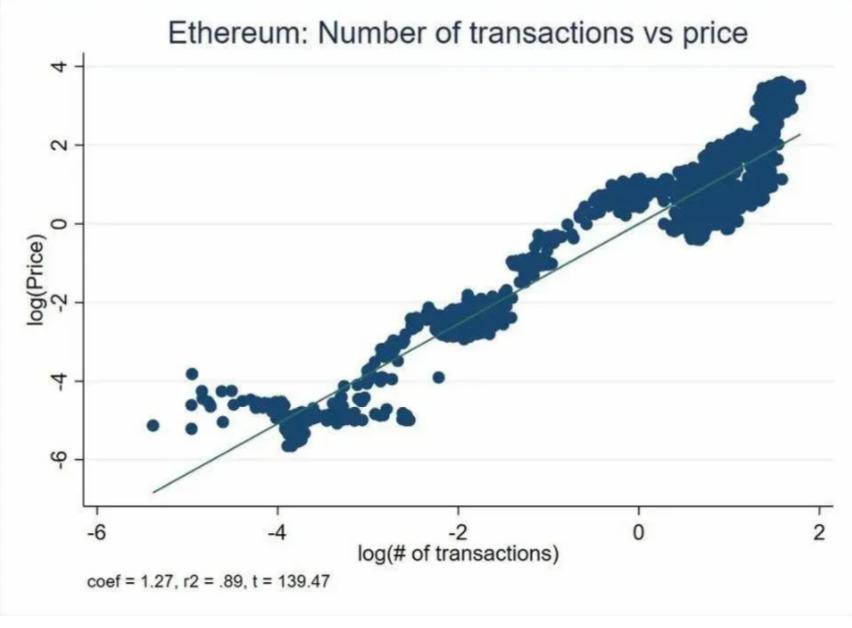
Actual data confirms the relationship between these variables and the token/dollar exchange rate.
28/ By the way, the growth of transaction volume shows an almost linear correlation with the price growth of Ethereum and ETH: a 10% increase in transaction volume means an average price increase of 13%.
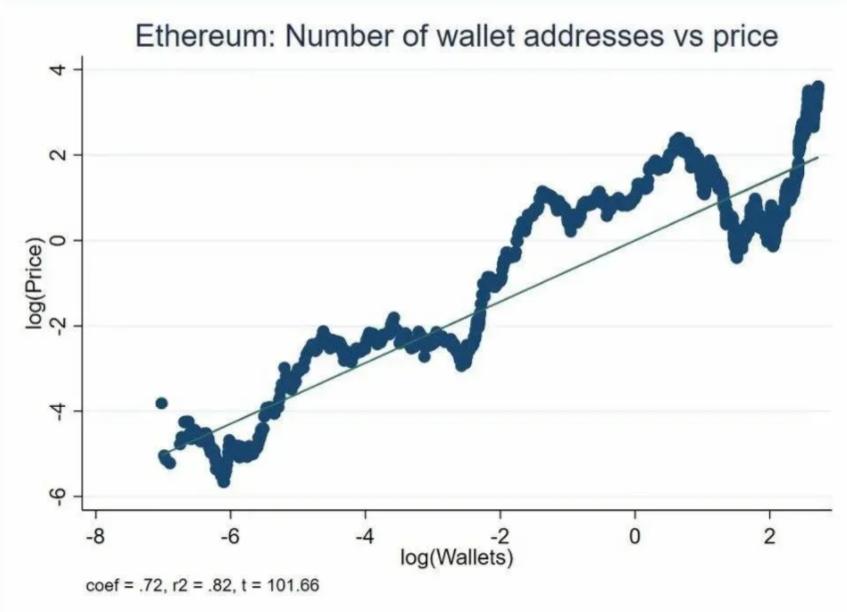
29/ Similarly, a 10% increase in the total number of wallets means an average price increase of 7%.
30/ The following chart is even more striking. The acceleration of wallet growth (i.e., the growth rate of new wallets) is almost 1:1 correlated with ETH price growth.
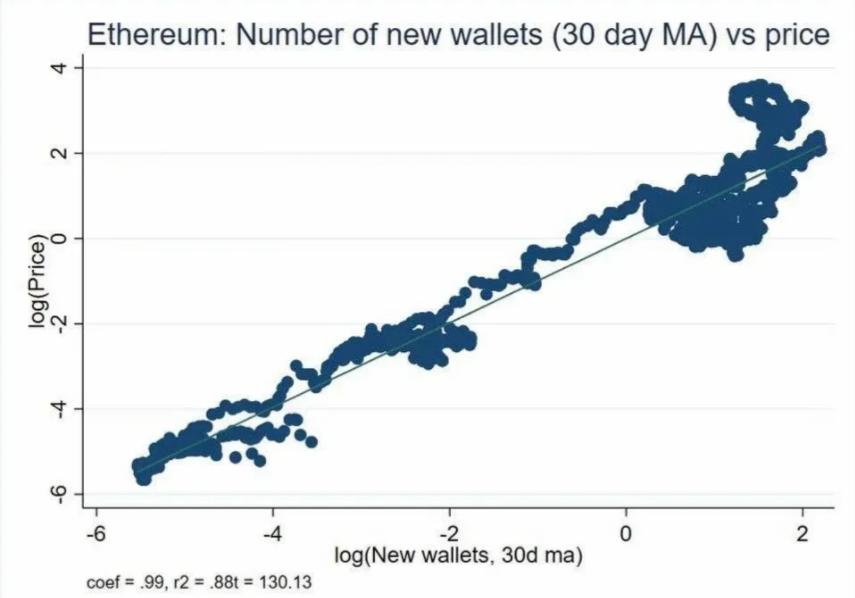
31/ And that's not all.
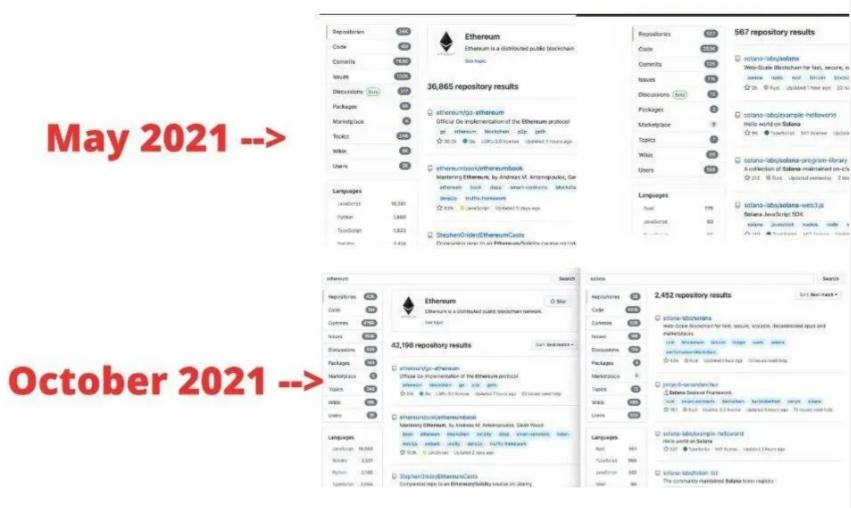
Software development in the virtual world is like the construction industry in the real economy— a leading indicator of GDP growth. It can be said that developer activity on L1 platforms is more indicative of impending economic expansion than transactions or wallets.
32/ Back in May, if you searched for "ethereum" and "solana" on Github, the former returned 65 times the number of repo results as the latter. By October, that multiple had shrunk to 17 times—positively correlated with the rapid growth of the "Solana nation."
33/ All of this is not to say that the cash flow of the platform itself is unimportant.
This is crucial for the stability of L1 tokens.
34/ It is no coincidence that governments become the monopoly issuers of currency. Historically, there have been many forms of private currency. But they never lasted long and were always supplanted by government currency.
35/ Among the many issues with private currencies, the lack of a "fiscal base" is the most serious problem.
36/ Governments can protect the value of their currency through taxation, which is the most stable and almost guaranteed source of income. Even if fiat currency is "unsupported," the government can raise resources through taxation and use those resources to buy/sell its currency to defend its value.
37/ This is a big deal that can instill confidence in currency holders.
Non-government currencies cannot say the same, well… until now.
38/ By incorporating transaction fees into every economic activity on the platform and using them for token burn or staking rewards, the currency of the "blockchain nation" is gaining fiscal support similar to that of government currency.
39/ As we have discussed, while these cash flows do not determine token prices, they help maintain exchange rate stability in the long run.
40/ But for token prices, the most important factor remains the GDP growth of the cryptocurrency "nation." Since the metaverse is still in its infancy, the story has just begun.
 Risk warning
 Risk warning