Data: The Ethereum spot ETF had a net outflow of 8.64 million USD last week, while the Grayscale Ethereum Trust ETF ETH had the highest weekly net outflow of 6.66 million USD
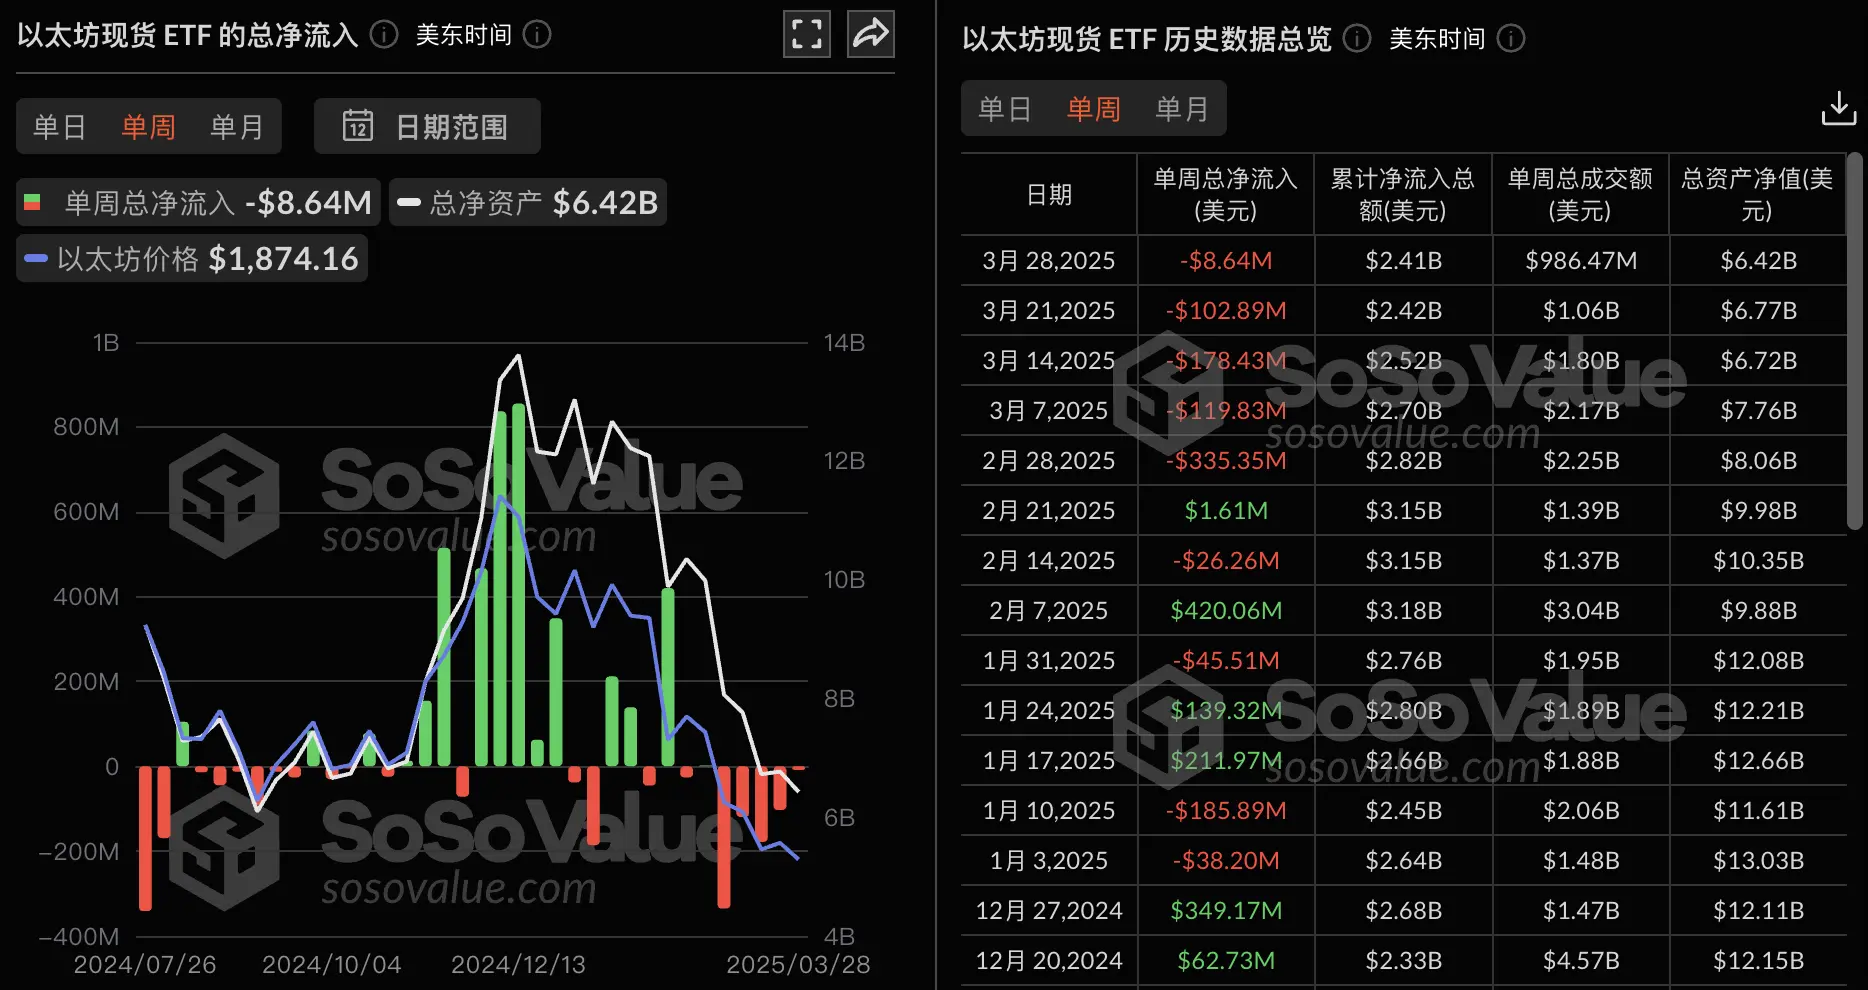
ChainCatcher message, according to SoSoValue data, the Ethereum spot ETF had a net outflow of $8.64 million for the week from March 24 to March 28 (Eastern Time).
The Ethereum ETF with the highest net inflow last week was the Grayscale Ethereum Trust ETF (ETHE), with a weekly net inflow of $4.68 million. Currently, ETHE has a historical total net outflow of $4.17 billion.
The Ethereum mini trust ETF with the highest net outflow last week was the Grayscale Ethereum Mini Trust ETF (ETH), with a weekly net outflow of $6.66 million. Currently, ETH has a historical total net inflow of $571 million. Following that is the Fidelity Ethereum ETF (FETH), with a weekly net outflow of $3 million, and currently, FETH has a historical total net inflow of $1.41 billion.
As of the time of publication, the total net asset value of Ethereum spot ETFs is $6.42 billion, with an ETF net asset ratio (market value as a percentage of total Ethereum market value) of 2.84%, and the historical cumulative net inflow has reached $2.41 billion.

 Risk warning Risk warning