DEX is not dead, CEX is just riding the wind


 Traders choose where to trade not only based on trust but also on the additional features of the platform.
Author: Prathik Desai
Compiled by: Block unicorn
Introduction
The past year has been full of changes for centralized exchanges (CEX) and decentralized exchanges (DEX). Over the last 12 to 18 months, participants in the cryptocurrency space have witnessed a shift in trading momentum and liquidity from centralized exchanges (CEX), which rely on trust and compliance, to decentralized exchanges (DEX) that promise user transparency, composability, and self-custody.
Despite media reports claiming a strong return of centralized trading, a deeper analysis of the data reveals that the reality is much more complex.
In this quantitative analysis, I will delve into the data of DEX and CEX to better understand the evolution of spot and leveraged liquidity in cryptocurrency trading.
The Battle Between CEX and DEX
In the long run, 2025 seems to be a year of strong recovery for centralized exchanges (CEX) after nearly two years of declining confidence and shrinking liquidity. From January 2021 to May 2022, the average monthly trading volume of centralized exchanges far exceeded $1.5 trillion. However, since June 2022, until November 2023, the monthly trading volume has only surpassed the $1 trillion mark once.
Over the past two years, CEX trading volumes have surged. Thanks to favorable factors from ETFs and the macro economy, trading volumes have reached new highs. By December 2024, this figure had climbed to $2.94 trillion.
The fourth quarter of 2024 marked a turning point in trading volume growth. The spot trading volume of CEX skyrocketed from $1.14 trillion in October to $2.94 trillion in December, pushing the average monthly trading volume for the quarter above $2.25 trillion.
This growth coincided with a rise in market risk appetite following the re-election of U.S. President Donald Trump and the ongoing negotiations supporting cryptocurrency regulation.

The first quarter of 2025 continued this growth momentum, with an average monthly trading volume nearing $1.8 trillion, but it dropped by about 30% in the second quarter to $1.3 trillion. However, in the third quarter of 2025, trading volumes quickly rebounded, with average monthly trading volumes exceeding $1.8 trillion.
While centralized exchanges (CEX) experienced a strong recovery, decentralized exchanges (DEX) did not stagnate. In fact, their growth rate continued to surpass that of centralized exchanges.
In January 2024, the spot trading volume of DEX was approximately $133 billion. Just 18 months later, this figure quadrupled, exceeding $540 billion.
In the first quarter of 2025, the average monthly trading volume for DEX was $395 billion, and in the second quarter, it was $332 billion. By the third quarter of 2025, the average monthly trading volume had increased by 50% to $480 billion. The trading volume in October had already surpassed $540 billion.
So far this year, the spot trading volume of decentralized exchanges (DEX) has accounted for nearly 20% of all spot trading volume, up from just over 10% in 2024. Although centralized exchanges (CEX) still dominate the market due to the advantages of fiat recharge channels, DEX has become the preferred choice for users seeking speed, composability, anonymity, and self-custody.
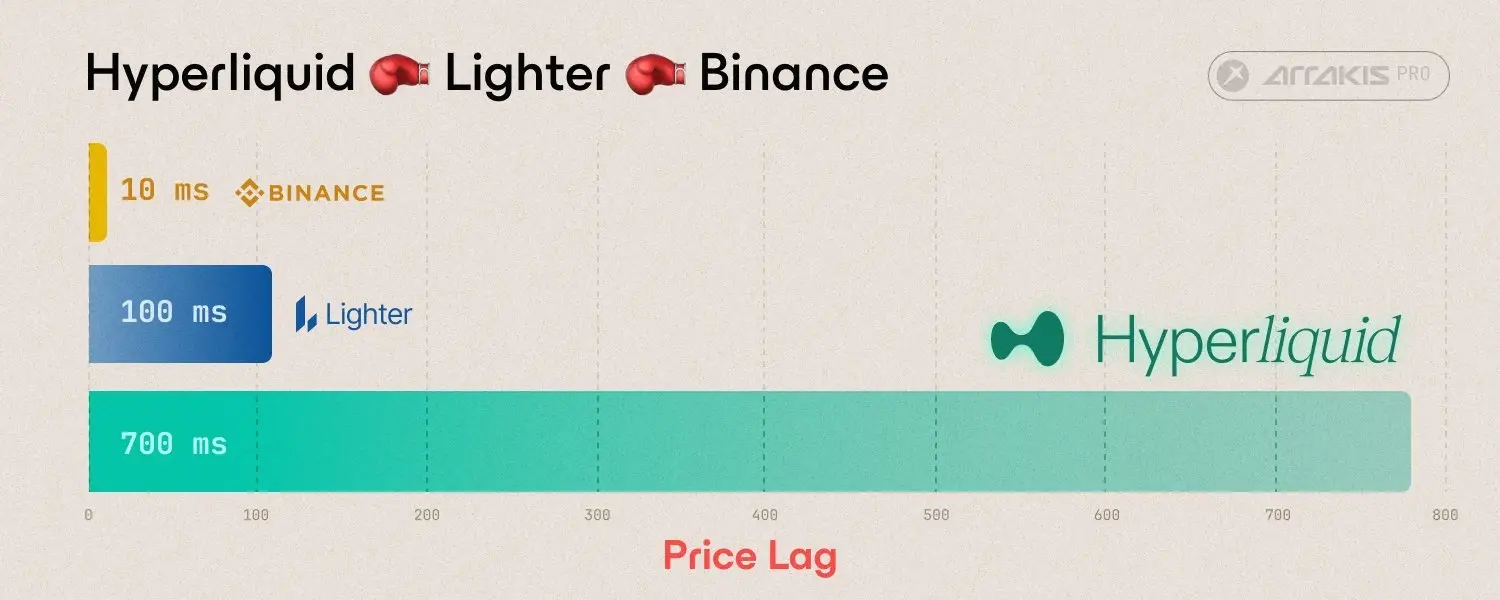
Protocols like Uniswap v4, Hyperliquid L1, and Raydium offer better user experiences, lower gas fees, and tighter spreads, narrowing the experiential gap between the two ecosystems.

The Driving Force Behind Derivatives
If you were to ask me what the most important factor driving DEX activity is, I would not hesitate to choose perpetual contracts. Before 2024, on-chain perpetual contracts were still a niche product, with monthly trading volumes only in the hundreds of billions. This was primarily concentrated in protocols like dYdX, GMX, and a few other DEXs based on Arbitrum. However, by the end of 2025, the scale of these platforms began to rival that of the entire decentralized exchange (DEX) spot market.

In January 2024, the monthly trading volume of perpetual contract DEX was $127 billion. By December 2024, this figure had nearly tripled to $345 billion.
But 2025 changed this trend. The average monthly trading volume of perpetual contracts grew from $332 billion in the first quarter to $688 billion in the third quarter, more than doubling. In October alone, its trading volume exceeded $1.13 trillion, marking the first month that on-chain derivatives trading volume surpassed $1 trillion, more than double the size of the DEX spot market.
These figures indicate not only that more traders are entering the on-chain space but also that the trading activity of each trader has increased. On-chain DEXs offering perpetual contracts now replicate some features of centralized exchanges (CEX), such as isolated margin, deep order books, and cross-chain collateral. Additionally, they offer a high degree of composability that CEXs cannot provide. These advantages are sufficient to retain many high-value traders on-chain.
This trend is reflected in the steadily increasing ratio of trading between decentralized exchanges (DEX) and centralized exchanges (CEX) in derivatives trading.
In 2024, decentralized exchanges handled less than 5% of global futures trading volume. By mid-2025, this figure had doubled to 10%, and by October, it reached 14.3%, setting a record for the highest proportion of on-chain derivatives relative to centralized exchanges.

Compared to the scale of Binance, this number is still small, but it signals the direction of future development. While the derivatives trading volume of centralized exchanges has remained relatively stable this year, the trading volume of decentralized exchanges has been growing each quarter since mid-2023.
While trading volume can reflect part of the situation, open interest (OI) provides more detailed information. As of January 1, 2024, the open interest of on-chain exchanges accounted for only 1.5% of global derivatives trading volume. By December 31, 2024, this ratio had doubled to 3.7%, reaching 5.9% by June 30, 2025. By September 30, 2025, this ratio had reached 9.8%. In less than two years, it grew more than 6.5 times.

These changes collectively indicate that although centralized exchanges (CEX) remain liquidity centers, decentralized exchanges (DEX) are quickly becoming the new risk centers. The choice of where traders conduct their transactions depends not only on trust but also on the additional features offered by the platform.
The growth of DEX in the spot, derivatives, and perpetual contract sectors indicates that they provide functionalities that CEX cannot replicate, at least not for now. The absolute number of on-chain traders may still be small, but their intentions and the features they demand send a clear message to cryptocurrency developers: what aspects should be prioritized when developing cryptocurrency exchanges.
This concludes the quantitative analysis report. See you in the next article.
Recommended Reading:
Under the Savage Harvest, Who is Looking Forward to the Next COAI?
Interview with Bittensor Founder Jacob: Applying Mining to AI, TOP 3 Subnets Built by Chinese Teams
YZi Labs Heavy Report: Positioning, Economic Model, and Core Competitiveness of BNB
 Risk warning
 Risk warning