Data: SOL spot ETF net inflow of 20.3 million USD last week
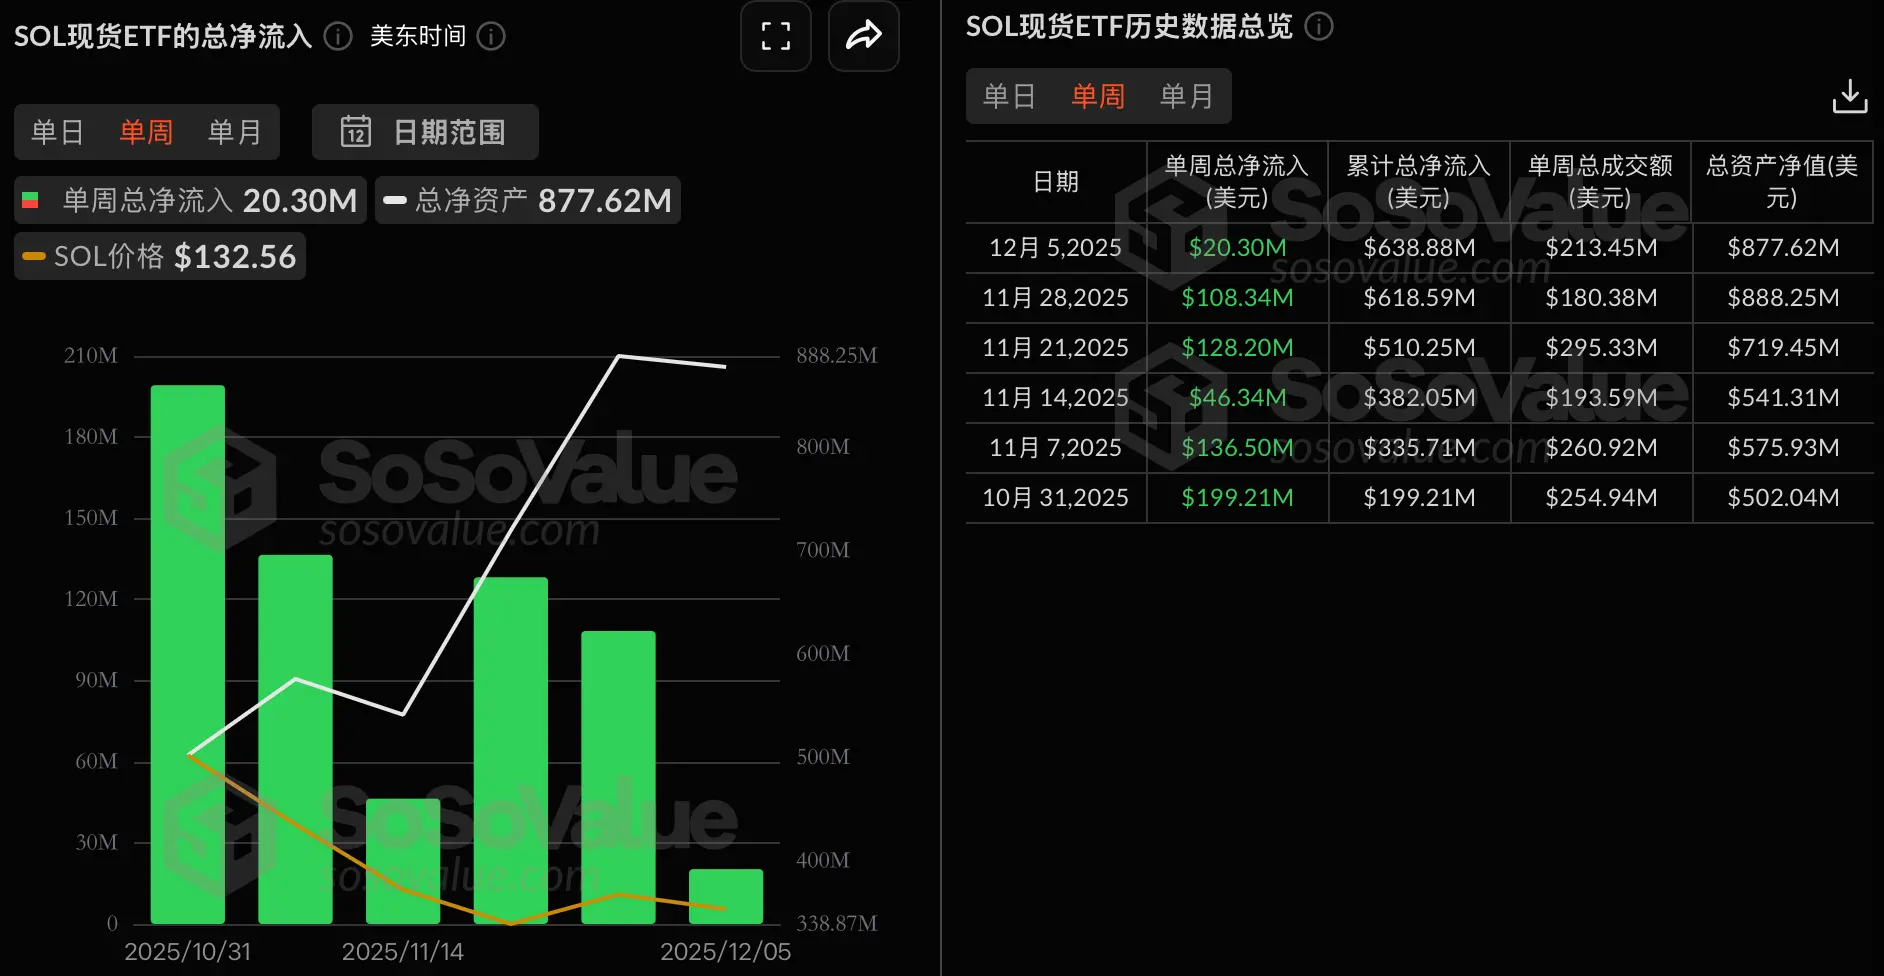
According to SoSoValue data, the SOL spot ETF had a net inflow of $20.3 million for the week of trading days (Eastern Time from December 1 to December 5).
The SOL spot ETF with the highest net inflow last week was the Bitwise Solana Spot ETF (BSOL), with a weekly net inflow of $65.11 million, bringing its historical total net inflow to $593 million. The second was the Fidelity SOL ETF (FSOL), with a weekly net inflow of $14.11 million, currently having a historical total net inflow of $46.42 million.
The SOL spot ETF with the highest net outflow last week was the 21Shares Spot ETF (TSOL), with a weekly net outflow of $73.91 million, currently having a historical total net outflow of $102 million.
As of the time of publication, the total net asset value of SOL spot ETFs is $878 million, with an ETF net asset ratio (market cap compared to Bitcoin's total market cap) of 1.18%, and the historical cumulative net inflow has reached $639 million.

 Risk warning Risk warning