Binance Research: AI trading is shifting from semiconductors to software and capital markets
 Core Viewpoint

 Market concentration is declining. Binance investors are also reducing their concentrated allocation in the semiconductor industry and shifting funds towards the software and capital markets industries.
Author: Lim Kim Thye
Compiled by: Wu Says Blockchain
Core Summary
· With the continuous decline in unit capability costs, the growth in Token usage benefits hyperscale cloud service providers, whose infrastructure business profit margins reach 33% to 38%.
· The ratio of capital expenditure to operating cash flow rises from 41% in 2023 to about 105% in 2026. The total free cash flow of related companies has turned negative, and the funding gap is starting to be filled by debt financing.
· The market's pricing logic has changed: capital expenditures that cannot be converted into actual growth will be penalized, while investments that can drive AI revenue growth will receive positive feedback.
· Market concentration is decreasing. Binance investors are also reducing their concentrated allocations in the semiconductor industry and shifting funds towards software and capital markets.
The Trend of Token Maximization Ends in the Second Quarter, Two Curves Begin to Diverge
The second quarter ended the assumption that increased Token consumption would directly translate into model layer revenue. Companies realized that Token consumption is not linearly related to productivity, and thus no longer blindly pursue maximization of Token usage. Meanwhile, AI Agents are rapidly becoming popular, and the market is more focused on the efficiency of Tokens required to complete individual tasks. The development focus of cutting-edge models has also shifted from inference benchmarking to Agent programming, memory architecture, and cost-effective lightweight inference.
As of early September 2026, the weekly Token usage routed through OpenRouter reached 137 trillion, about 20 times that at the beginning of the year. Open-weight models account for more than half of the inference Tokens in the platform's production environment, up from one-third in the previous study, and all five models with the highest Token usage adopt open weights. These models have capabilities about 90% of closed-source models, yet the cost per call is only about one-sixth of the latter. Stripe maintained 50 million calls per day while reducing its GPU cluster to one-third of its original size, resulting in a 73% decrease in inference costs.
As a result, the benefits brought by AI growth began to diverge. Companies select models based on specific tasks, and an AI Agent typically consumes thousands of Tokens to complete a task, making low-cost open-weight models key to achieving economic viability for long-running Agents. With the decline in unit capability costs, the growth in Token usage benefits hyperscale cloud infrastructure providers with profit margins reaching 33% to 38%, but companies directly selling model capabilities find it harder to convert that into revenue.
Figure 1: Token usage approaches 150 trillion, Token price index peaked at $2.62 in July
Capital Expenditure Exceeds Operating Cash Flow
The capital expenditure guidance from the five major U.S. cloud computing operators for 2026 totals $725 billion to $800 billion, depending on whether financing leases and prepayments are included.
More noteworthy than the absolute amount is the ratio of capital expenditure to operating cash flow. The capital expenditure of the five companies has risen from 41% of operating cash flow in 2023 to about 105% in 2026. This means that the funds they use to expand infrastructure capacity have exceeded the cash generated from their core business.
This change is quickly reflected in free cash flow. Alphabet reported a free cash flow of negative $5.9 billion for the quarter, marking its first negative result since going public. Meta's free cash flow fell from $8.5 billion in the same period last year to $784 million. Over the past 12 months, Amazon's free cash flow was negative $7.6 billion, while Oracle consumed $23.7 billion in cash in fiscal year 2026. The total free cash flow of the five companies shifted from a positive $246 billion in 2024 to about negative $37 billion in 2026, marking the first negative shift in this investment cycle.
As internal cash can no longer cover investment needs, external financing has begun to become the main source of funds. The proportion of debt financing in the capital expenditures of hyperscale cloud service providers has risen from 9% in fiscal year 2024 to 32% in the past 12 months as of mid-2026, with the total debt of the five companies around $700 billion.
An observation by the Bank for International Settlements (BIS) is particularly noteworthy: the loan spread for AI private credit is about 6.2 percentage points, close to the financing spread for non-AI borrowers. In other words, the risks already reflected in the stock market have not yet been fully priced in the credit market.
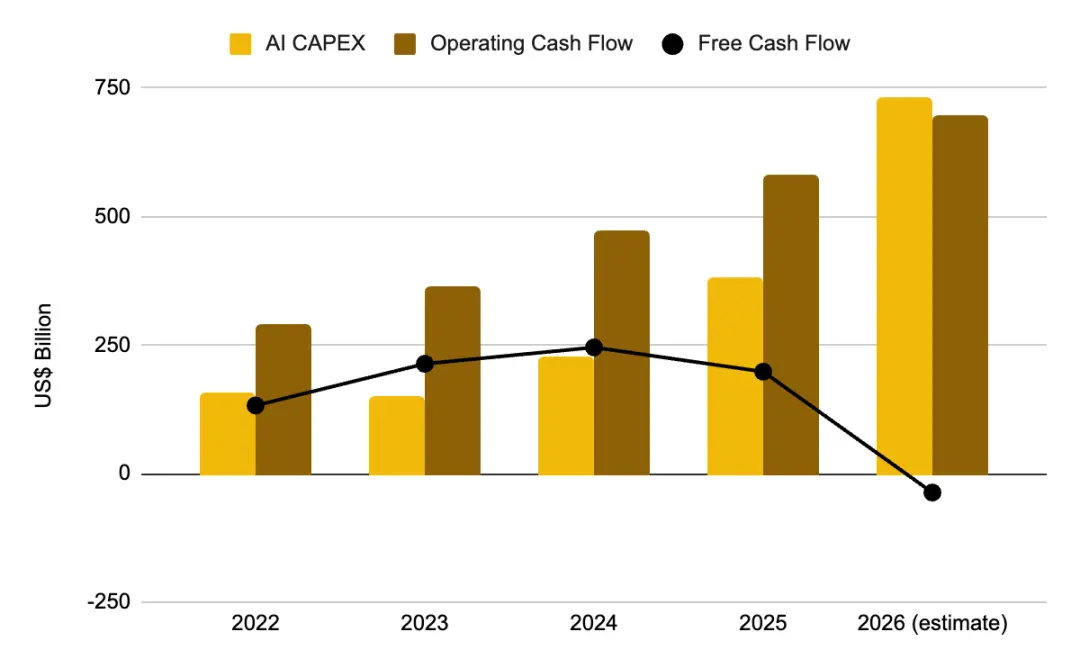
Figure 2: Capital expenditure exceeds operating cash flow in 2026, free cash flow turns negative
Demand Signals Are Huge, But the Realization Cycle Is Long
Three companies exhibit the same trend.
· Google Cloud revenue grew 82% to $24.8 billion, with operating profit margins rising from 20.7% to 35.6%, and unfulfilled contract amounts reaching $514 billion. Currently, Google Cloud processes 22 billion Tokens per minute, up from 16 billion in the previous quarter.
· Microsoft's remaining performance obligations (RPO) reached $678 billion, an 84% year-over-year increase. Azure revenue grew 43%, and paid seats for Microsoft 365 Copilot surpassed 30 million.
· Oracle's remaining performance obligations reached $638 billion, a 363% year-over-year increase. However, the company's disclosed data shows that only about 12% will convert to revenue in the next 12 months, and about 20% will not be realized until five years later.
In terms of model companies, Anthropic's annualized revenue is about $47 billion, while OpenAI's is about $25 billion. Both companies are currently in a loss position and are preparing for an IPO. Goldman Sachs predicts that by 2030, Token consumption will grow to 24 times the current level, but only 12% of knowledge workers will use Agent AI by then.
The scale of these numbers is indeed enormous, but very few can be converted into actual revenue in the short term, and this time lag is key to the subsequent analysis of this report. Unfulfilled orders do exist, and capital expenditures have already occurred, but hyperscale cloud service providers and cutting-edge model companies must quickly convert contract demand into confirmed revenue to justify these investments. Meanwhile, the underlying assets supporting these businesses typically need to be depreciated over four to six years.
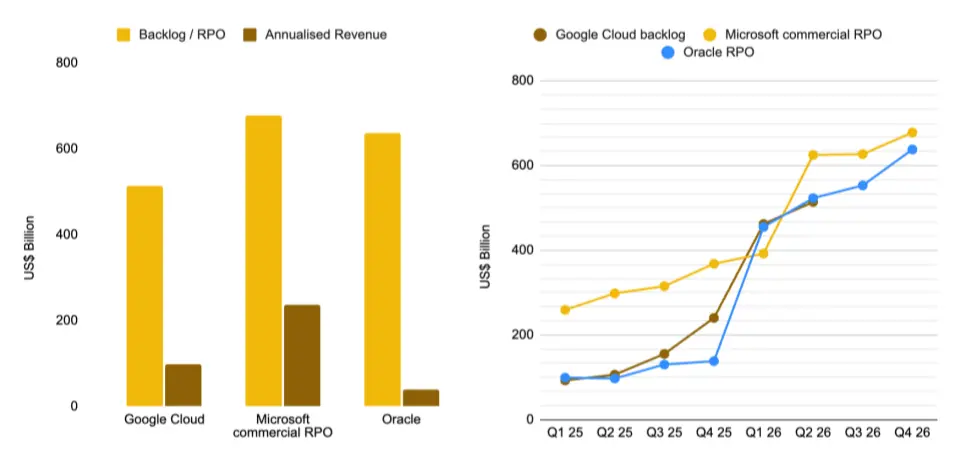
Figure 3: Unfulfilled orders far exceed current revenue, Google Cloud at $514 billion, Oracle at $638 billion
The Market's Pricing Logic Has Reversed
Investors have begun to factor these elements into pricing, and the latest earnings season clearly reflects this change.
Overall data is insufficient to fully present this shift, while individual stock performance is more representative. Among index constituents, companies with earnings per share exceeding expectations averaged a 0.6% increase, lower than the past five-year average of 1.0%; companies with disappointing performance averaged a 2.5% decline, also smaller than the past five-year average of 3.0%. The market's overall reaction to both positive and negative news has weakened, but there has been significant differentiation within the AI sector.
Calculating from the first full trading day after earnings reports, the differentiation is very clear. Alphabet's revenue grew 24%, cloud business grew 82%, yet its stock price fell 7.13%, solely due to the company raising its capital expenditure guidance. Meta's stock price dropped 7.95% due to earnings per share falling short of expectations, again raising capital expenditure, and free cash flow dropping to $784 million.
On the other side, the performance is equally striking. Microsoft's Azure revenue grew 43%, remaining performance obligations grew 84%, and a slight reduction in capital expenditure for the calendar year 2026 drove its stock price up 15.51%, marking the largest single-day increase since 2008.
Amazon raised its capital expenditure to $220 billion, but due to AWS growth accelerating to 37%, its stock price still rose 15.32%, pushing its market value above $3 trillion. Nvidia rose 8.74%. Palantir, which requires almost no capital investment to expand infrastructure, rose 29.45%.
The criteria adopted by the market have become very clear: unless it can be proven that investments are translating into growth, capital expenditure is a burden. For this reason, although both raised capital expenditure, Alphabet faced market punishment while Amazon received positive feedback.
Figure 4: Both raised capital expenditure, resulting in completely opposite outcomes, Alphabet down 7.1%, Amazon up 15.3%
The Market's Main Line in 2026 Is Diffusion, Not Further Concentration
Market concentration has peaked and begun to decline. The weight of the "Big Seven Tech Giants" in the S&P 500 index has decreased from about 35.3% in October 2025 to 33.2% in September 2026. As of August, the S&P 500 index has risen 12.28% year-to-date, the Nasdaq Composite Index has risen 13.46%, and the Russell 2000 small-cap index has risen 19.12%.
Among these, the performance of small-cap stocks is particularly noteworthy. This indicates that AI trading is spreading to industries such as industrials, power, and other indirectly benefiting sectors, rather than further concentrating on ultra-large-cap software companies. The equal-weighted index has outperformed the market-cap weighted index by about 3.6 percentage points, indicating that after the most easily accessible gains have been realized, funds are flowing into more volatile second-order beneficiaries.
However, current valuations limit the space for this rotation to continue. The expected price-to-earnings ratio of the S&P 500 index is about 19.6 times, slightly lower than the average of 19.9 times over the past five years, but higher than the average of 19.0 times over the past ten years. The interest rate environment has also failed to provide support, with the current effective federal funds rate at 3.63% and the yield on the 10-year U.S. Treasury bond at 4.77%.
Therefore, the current conclusion has reversed from last year: the market rally in 2026 is spreading to more industries and companies of different market capitalizations, while the excessive allocation of passive portfolios to AI leading stocks is shrinking rather than continuing to increase.
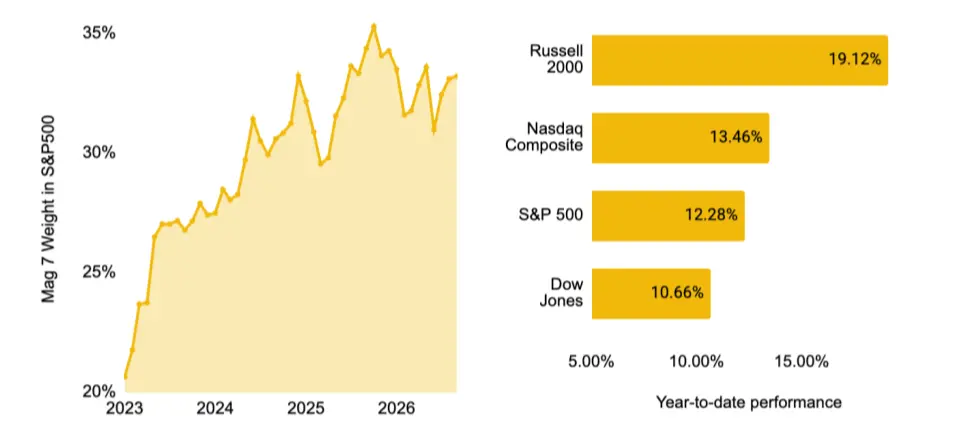
Figure 5: The weight of the "Big Seven Tech Giants" has declined from a high, with Russell 2000 leading with a year-to-date increase of 19.12%
Binance investors are also diversifying their allocations, but starting points are more concentrated
Comparing data from the end of June 2026 and September 4, it can be seen that the adjustment direction of the S&P 500 index is basically consistent with that of Binance users' stock holdings. The weight of the semiconductor industry in the S&P 500 has decreased from 18.8% to 14.8%, and the technology hardware industry has decreased from 6.8% to 6.2%; Binance investors have made larger adjustments, with their technology hardware holdings dropping from 15.92% to 7.94%.
During the same period, the weight of almost all other industries in the S&P 500 has slightly increased, indicating that funds have not shifted to another single theme, but rather diversified from previously highly concentrated areas to multiple industries. Binance investors have continued to reduce their holdings in aerospace and defense, interactive media and services, and industrial stocks, while increasing their holdings in capital markets, software, and general retail industries.
There are three main differences between Binance investors and the benchmark index: the semiconductor allocation ratio is as high as 42.08%, significantly higher than that of the S&P 500; the capital markets industry allocation reflects their crypto-related preferences; and the concentration of holdings is also higher, with the top ten industries accounting for about 92% of their stock allocation, while the top ten industries in the S&P 500 account for about 53%.
Figure 6: From June to September, the weight of semiconductors in the S&P 500 and Binance users' holdings has both decreased
Monthly capital flows reflect industry rotation in real-time
Monthly net capital flows further confirm the market diffusion trend and clearly present the process of monthly changes in investor positions.
July: Investors were still configuring around the AI theme and remained optimistic before the earnings season. Most investors bought during the market pullback in late July, with the semiconductor industry absorbing most of the net inflows, and the capital markets industry also receiving considerable funds.
August: Investors became more cautious. They began to take profits on capital market stocks while continuing to increase their semiconductor holdings, but the pace of fund inflows significantly slowed. Meanwhile, a large amount of capital shifted towards the software industry, with the overall net inflow for the month dropping to about half of July's.
Since September, the semiconductor industry has seen its first monthly net capital outflow, due to rising long-term interest rates putting pressure on risk assets. However, it should be noted that the current data only covers the first week of September, and the upcoming Federal Reserve interest rate decision may quickly reverse this trend.
A comprehensive observation of the data over these three months reveals that the portfolio remained highly concentrated in the AI hardware sector at the beginning of the quarter, gradually spreading to software, capital markets, and other second-order beneficiary industries. This is consistent with the industry rotation direction seen in the benchmark index, but comes from different investor groups and at a faster adjustment pace.
Figure 7: From July to September, funds flowed out of the semiconductor industry and shifted towards the software industry
Trading volume highly aligns with investor holdings
Trading activity closely matches the asset allocation structure of investors. The top ten industries by trading volume are basically the same as the main industries held by Binance investors. This indicates that investors are more likely to be continuously building and adjusting existing positions rather than engaging in short-term rotations between unrelated themes.
In September, the semiconductor industry led with a trading volume share of 33.84%, while the capital markets and software industries accounted for 16.71% and 13.67%, respectively. Together, these three accounted for about 64% of the trading volume in the top ten industries. The technology hardware industry followed with 10.42%, consistent with the trend of investors reducing their holdings in that sector mentioned earlier.
The concentration of holdings and trading in the same industries is an important signal when interpreting capital flows. When trading volume is concentrated in industries where investors are increasing their holdings, the related capital movements are more likely to represent a clear allocation intention rather than being purely driven by short-term turnover.
Pre-IPO perpetual contracts can directly price counterparty risk
Binance's Pre-IPO perpetual contracts allow investors to establish positions on valuations of private companies that other major platforms have not yet provided. After Anthropic reported quarterly revenue growth of over 100% and achieved a slight operating profit, its contract price rose by about 35% cumulatively in August; after OpenAI released its latest cutting-edge model Astra, its contract price rose by about 23% in early September, reflecting the market's immediate judgment on the model release.
These two model companies contribute a significant portion of the AI revenue of ultra-large-scale cloud service providers. Wells Fargo estimates that over 70% of Microsoft's AI revenue comes from the two; Barclays estimates that the two contribute about 73% of Amazon's AI revenue; UBS expects that the share of the two companies in Google Cloud's total revenue will rise from 28% in 2026 to over 48% in 2027. The $300 billion contract signed between OpenAI and Oracle also accounts for about half of Oracle's $638 billion in unfulfilled orders.
Therefore, the actual customer concentration is higher than what overall capital expenditure data shows, with related revenues highly concentrated in these two yet-to-be-listed counterparties. If either of them experiences a significant slowdown in growth, the impact will transmit from the AI revenue of ultra-large-scale cloud service providers to Oracle's unfulfilled orders, further affecting the securitized products that are vendor-supported and provide financing for related infrastructure. Currently, Pre-IPO perpetual contracts are one of the few tools that can directly hedge such specific risk exposures.
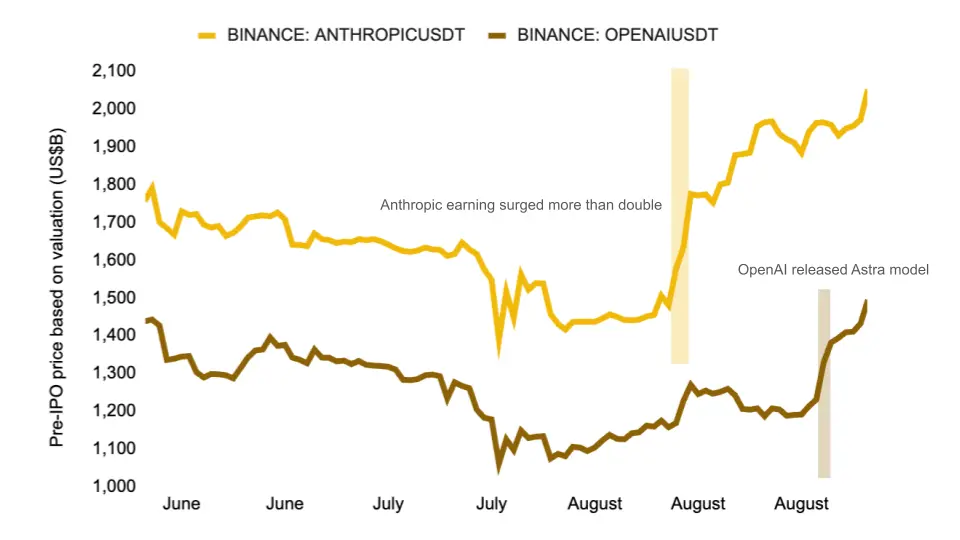
Figure 8: After Anthropic released its performance and OpenAI launched Astra, Pre-IPO contract prices were repriced

 Risk warning




Popular articles