The storm is coming: Is a potential upheaval in the cryptocurrency market about to erupt?

 The end of 2022 saw the cryptocurrency market remain very calm, but this situation usually does not last long. In the past, periods of such low volatility for Ethereum and Bitcoin typically occurred before extremely turbulent market conditions.
Original Title: 《A Volatility Slumber》
Original Author: Checkmate, Glassnode
Proofread by: Chi & Annie & Amber, Daling Think Tank
In the new year, the cryptocurrency market remains sluggish. The realized volatility of Bitcoin and Ethereum has dropped to extremely low levels. Based on previous experiences, such states generally occur before significant market fluctuations, with the last two instances resulting in asset valuations being halved, leading to new bull markets.
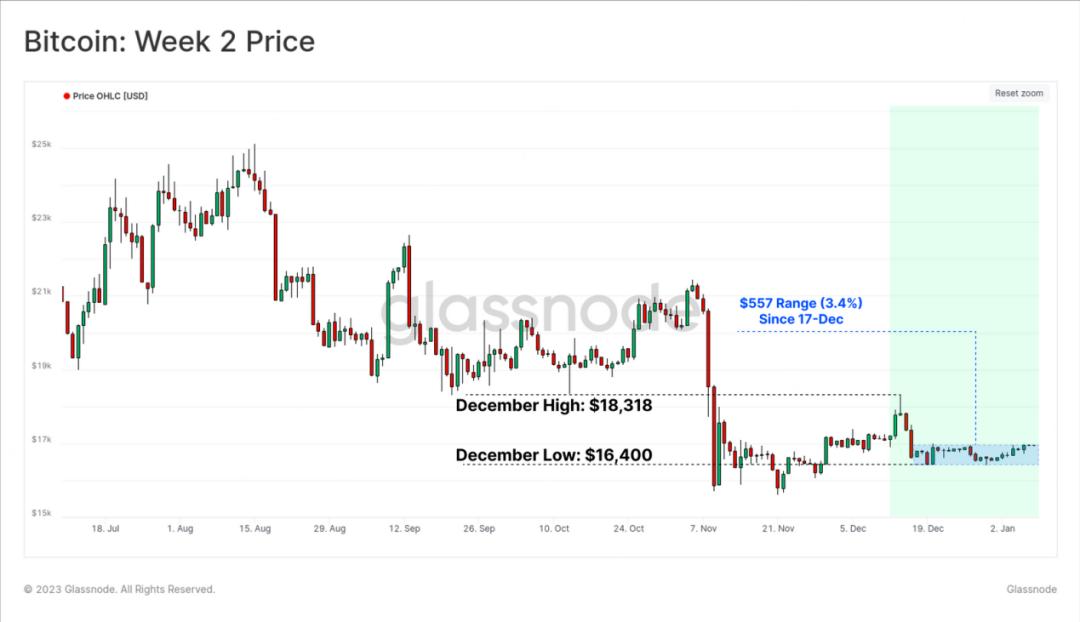
Bitcoin has rarely traded within the price range of $557 for more than three consecutive weeks, with the highest price ($169,000) only 3.4% higher than the range low of $164,000. Year-end is typically calm for all markets, and the cryptocurrency sector is no exception.
In this article, we will cover the following topics:
Currently, the realized volatility is extremely low. Based on previous experiences, such states generally occur before significant market fluctuations, with recent examples in November 2018 and April 2019.
The on-chain activity of BTC and ETH is weak, consistent with the overall low market volatility, indicating a weaker baseline for the new year.
The shrinking realized cap indicates that 2022 was one of the most severe bear markets in terms of capital loss to date.
 Bitcoin: Price in the Second Week
The Bitcoin market is known for its high volatility, yet it remains unusually calm at year-end. The realized volatility of Bitcoin last month dropped to a multi-year low of 24.6% (blue), with few instances of similar magnitude. All previous examples heralded higher future volatility, and most trading prices were also higher, with only one instance (November 2018) seeing a significant price drop.
Early bull market of 2012-13, Bitcoin prices ranged from $5 to $14.
Late stages of the 2015 bear market and several phases of the 2016 bull market.
November 2018, followed by a -50% reduction within a month.
April 2019, followed by a rebound from $4,200 to a peak of $14,000 in July 2019.
July 2020, followed by Bitcoin rising to $64,000 during the 2020-21 bull market.
 Bitcoin: Realized Volatility Last Month
In contrast, Ethereum has fewer calm periods, with monthly realized volatility plummeting to 39.8%. Historically, similar low market volatility has led to extreme fluctuations, such as in November 2018 (-58% sell-off) and July 2020 (2020-21 bull market).
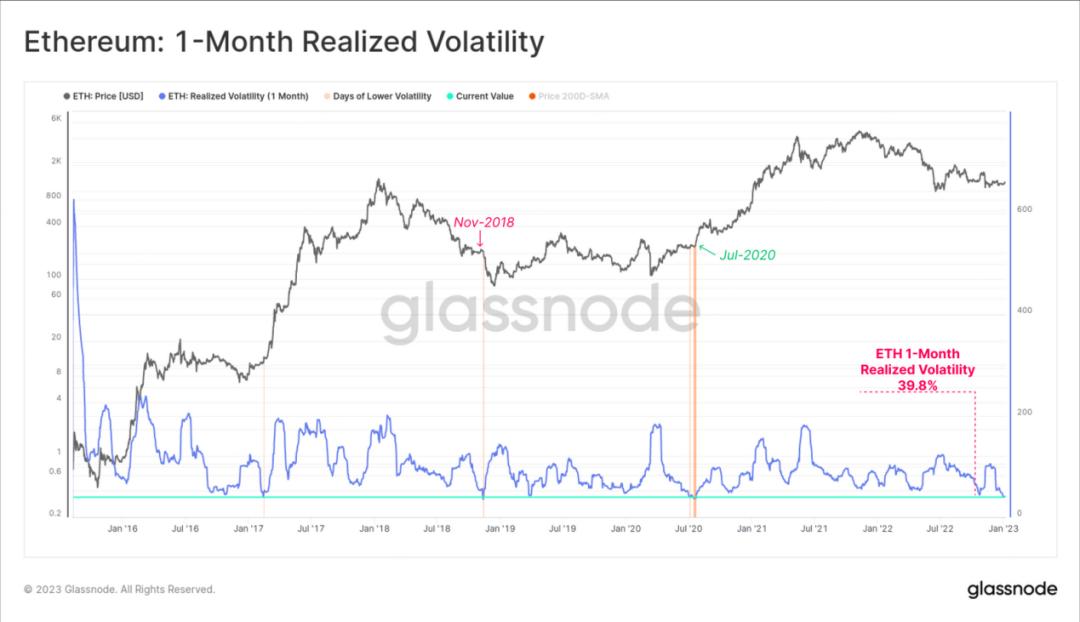
Ethereum: Realized Volatility Last Month
Weak Bitcoin Fundamentals
From the perspective of on-chain activity, we can see a short-term surge in new Bitcoin addresses following the collapse of FTX, but this has since cooled significantly. The monthly average of new addresses (red) is returning to the annual average baseline (blue), and on-chain activity has failed to maintain a sustained recovery. The trend of on-chain activity is a powerful tool for monitoring the recovery of network fundamentals.
Note: A drop in new addresses (30D-SMA) below 405,000/day may indicate sluggish on-chain activity and a negative trend.
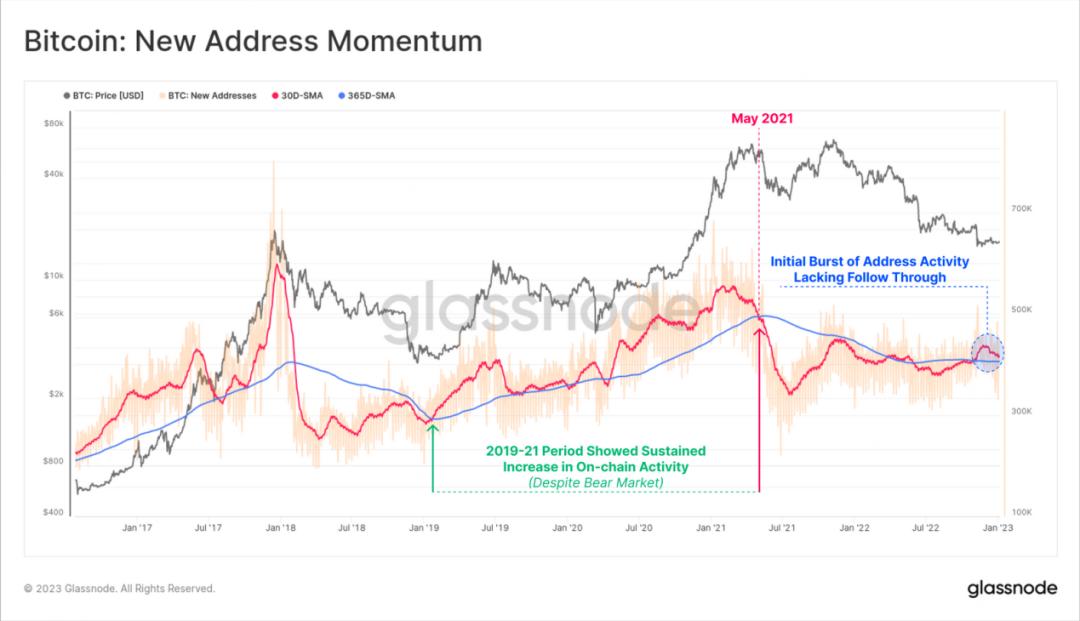
Bitcoin: New Address Growth Trend
Despite the short-term surge in new addresses, the total value of Bitcoin has been on a straight decline. Daily trading volume has plummeted from $40 billion/day in Q3 2022 to today's $5.8 billion/day.
This brings daily settlement volumes back to levels seen before the 2020 bull market and largely reflects the impact of institutional-sized funds being driven out.
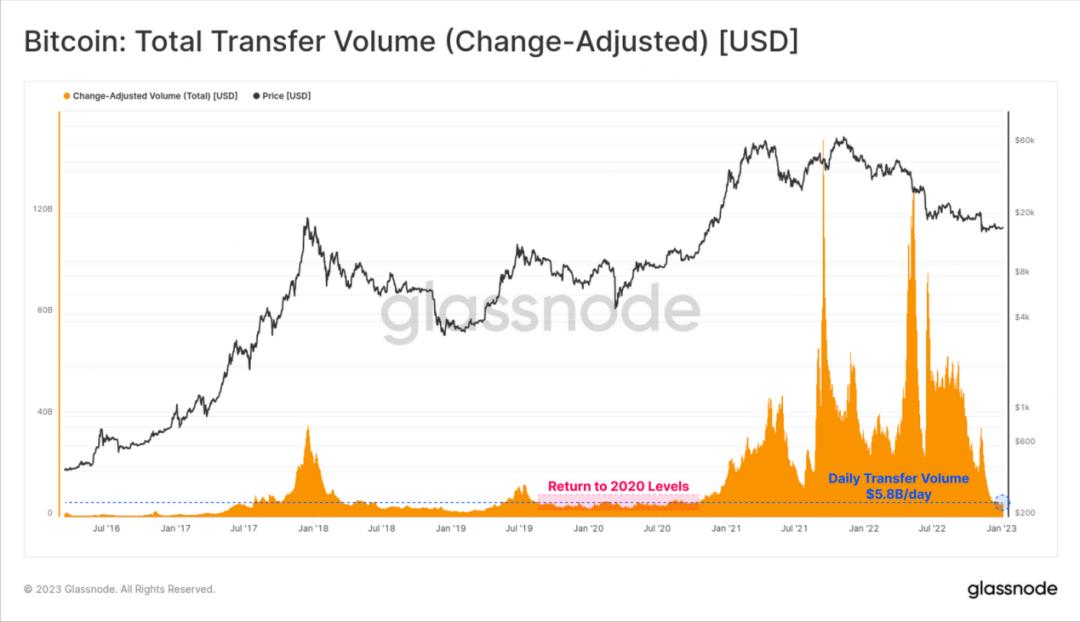
Bitcoin: Total Transaction Value (USD)
We can see this in the study of trading volume, where transactions over $10 million dominate, which is the main reason for the decline in trading volume. The proportion of large transactions has dropped from 42.8% before the FTX collapse to 19.0% today.
This indicates a significant stagnation in the flow of institutional-sized funds, and large holders may have experienced a strong shift in confidence. This may also be partly due to funds associated with FTX/Alameda being driven out.
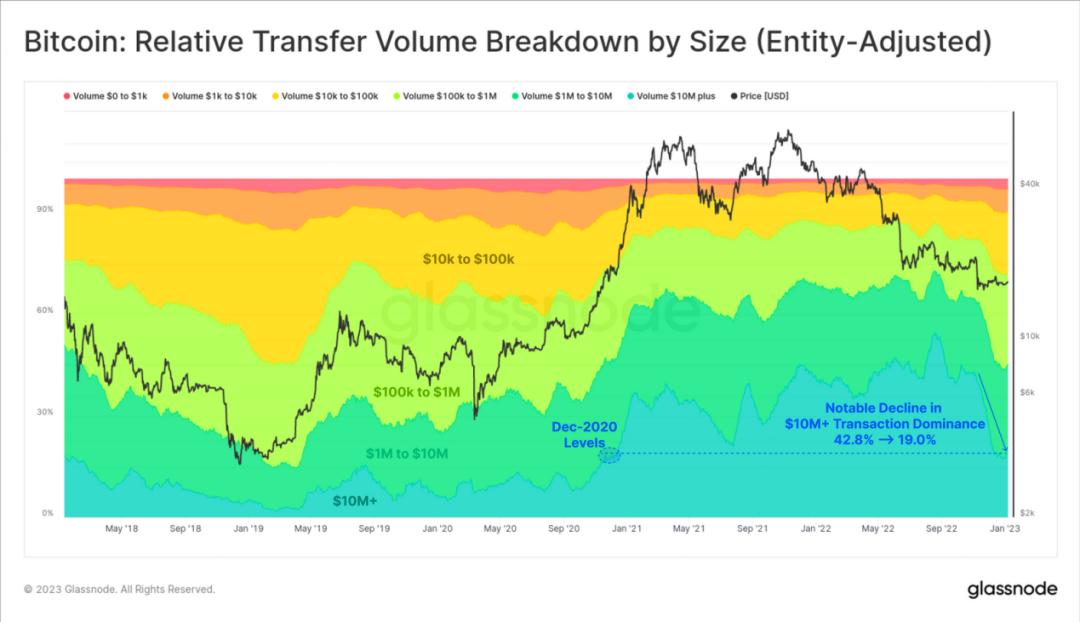
Bitcoin: Trading Volume by Size
The demand for Bitcoin mining remains weak, and the recovery of Bitcoin fee revenue has not had any significant impact. Although it has returned to positive values, it is still below the average of -0.67 standard deviations.
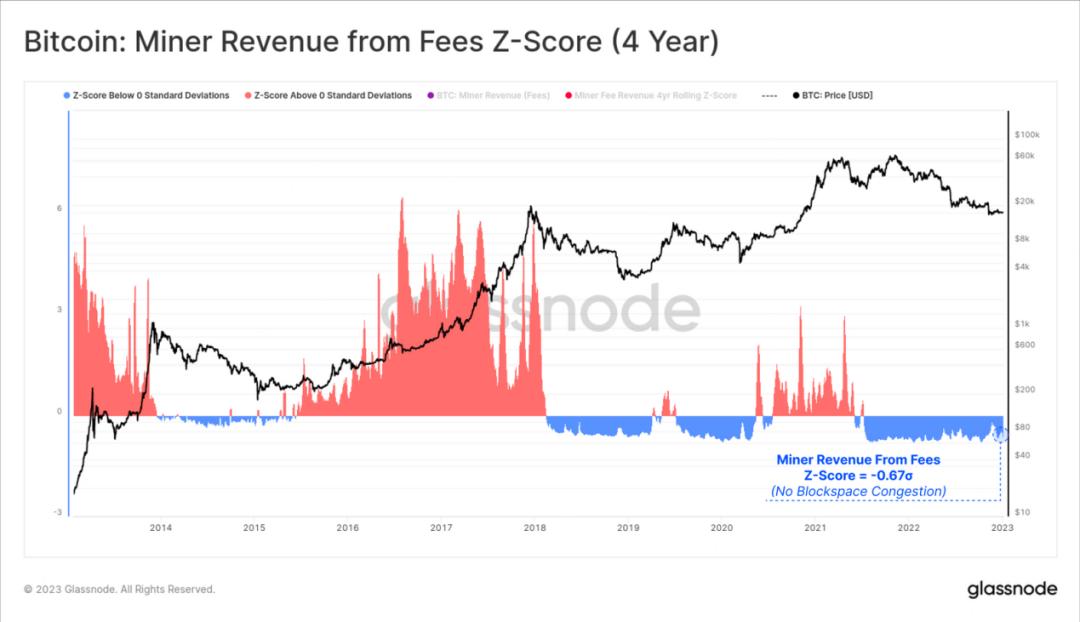
Bitcoin: Miner Revenue Fees (4 Years)
The on-chain silence can also be seen in the dollar-denominated trading platform flows of BTC and ETH. The chart below shows the inflows (positive) and outflows (negative) of Bitcoin (yellow) and Ethereum (blue) associated with certain trading platforms.
Currently, Bitcoin inflows are between $350 million and $400 million/day, which is far from the billions seen throughout 2021-22. It is also noteworthy that the scale of Ethereum trading flow has expanded, increasing from 30% in May 2021 to 42% today. Note: The ETH proportion here considers the total trading flow of Bitcoin and Ethereum (inflows and outflows), calculated as ETH / (BTC+ETH).
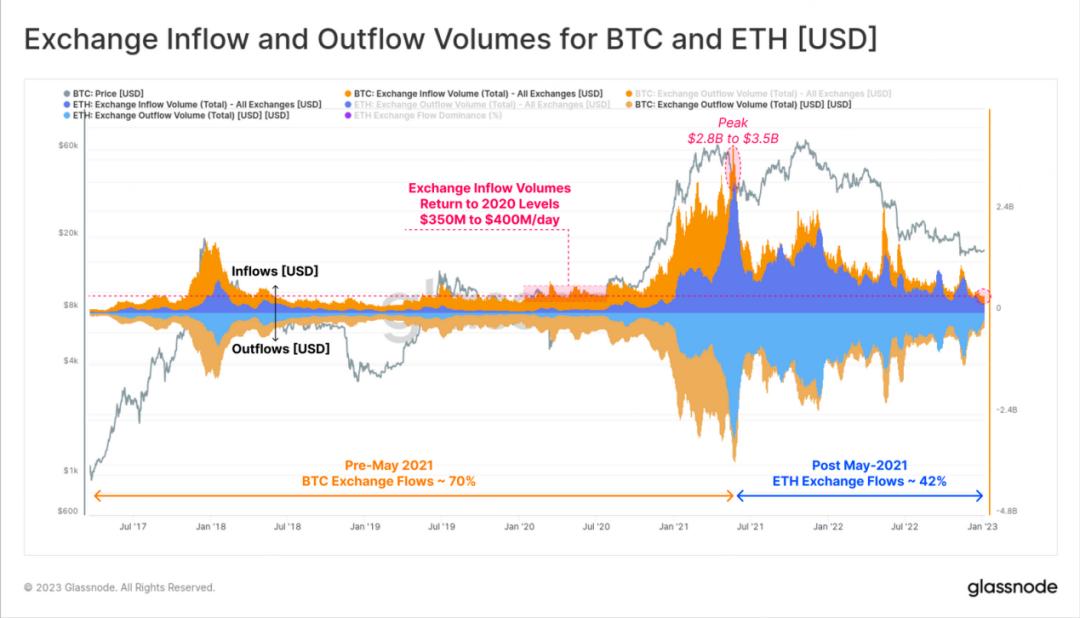
Bitcoin and Ethereum Trading Platform Flow Value
Ethereum On-Chain Slump
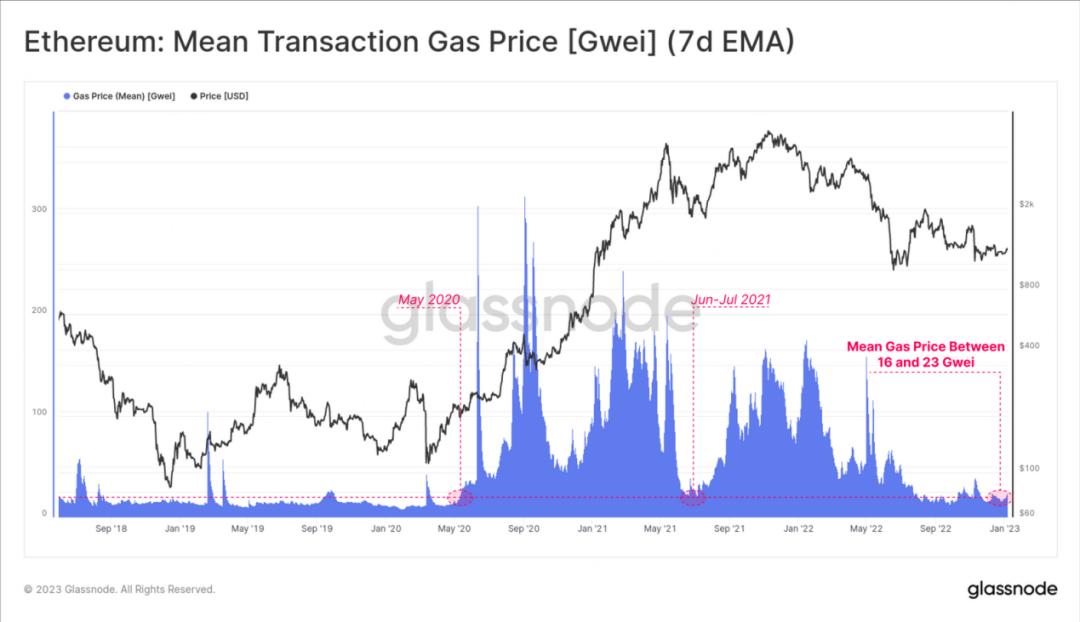
Bitcoin is not the only network experiencing extremely low on-chain utilization; the average Gas price for Ethereum on-chain payments remains close to cycle lows. The average Gas price since September has ranged between 16 and 23 Gwei, which is similar to levels seen during the consolidation period from June to July 2021 and shortly after the pandemic panic in May 2020.
Note: A breakthrough of the average Gas price (7D-SMA) above 30 Gwei may indicate an increase in on-chain activity, signaling increased demand for Ethereum mining.
Ethereum: Average Gas Price for Transactions
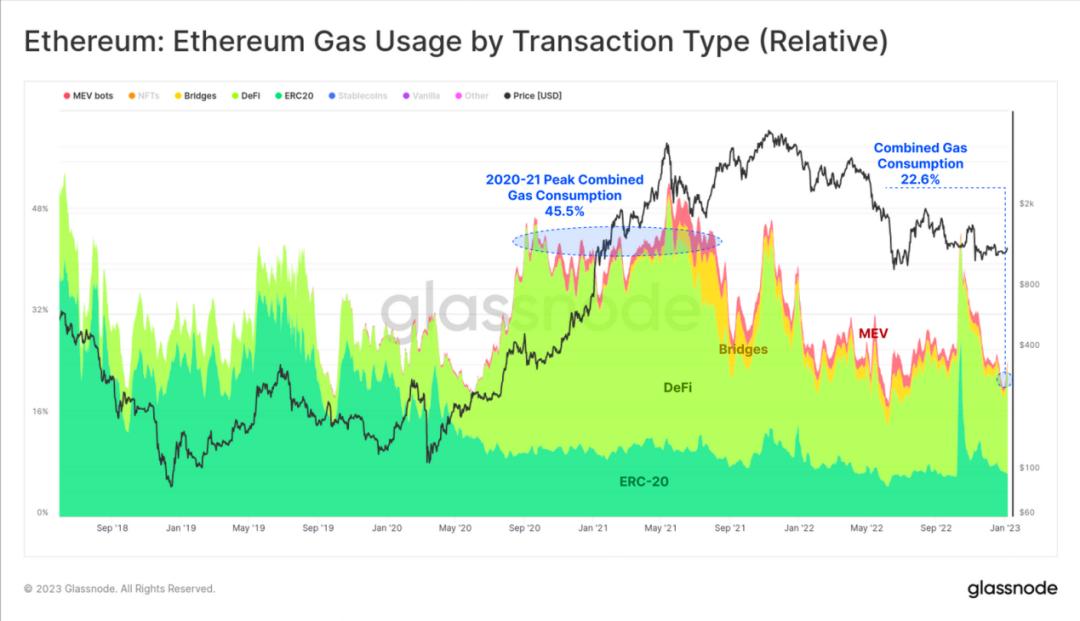
By segmenting Gas consumption by sector, we can see that the relative share of Gas consumption for several sectors is declining: MEV bots, cross-chain bridges, DeFi, and ERC-20. During the period from September 2020 to September 2021, these four sectors accounted for 45.5% of Gas consumption, with DeFi taking the majority.
However, today, these four sectors account for less than half of their peak share, making up 22.6% of Gas consumption.
Ethereum: Gas Consumption by Different Sectors
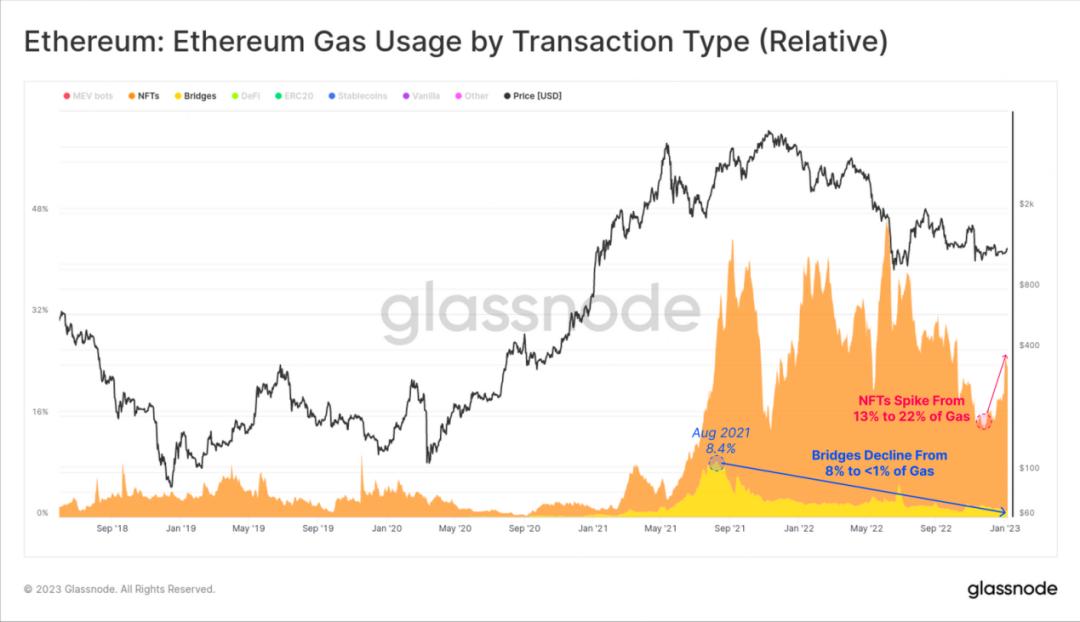
The most active and focused sector recently has been NFTs, which dominated Gas consumption throughout 2022, recently increasing from 13% to 22%.
Overall, the leading NFT sector has maintained a significant foothold on the Ethereum main chain, and so far, current NFTs have not migrated widely to cross-chain bridges or other chains. This may be due to several high-profile cross-chain bridge hacks in 2022 and the currently low Gas fees on the main chain.
Ethereum: Gas Consumption by Different Sectors
2022 Was One of the Most Severe Bear Markets in Terms of Capital Loss
The realized cap remains one of the most important indicators in on-chain analysis, helping us analyze the inflow and outflow of funds in digital assets. The fundamental assumption is that when cryptocurrencies are traded, their value is price-tagged, avoiding the valuation of long-lost tokens (like Satoshi's) at spot prices like market capitalization.
The realized cap can be considered one of the best tools for measuring real capital inflows and comparing the valuations of different assets. It filters out lost tokens and accounts for trading volume loss (the same cryptocurrency being traded repeatedly), better reflecting the true investment value of the market.
In this context, Bitcoin's realized cap has decreased by -18.8% since its ATH, representing a net capital outflow of $88.4 billion from the network. This is the second-largest relative decline in history and the largest realized loss to date. This has brought the realized cap back to levels seen in May 2021.
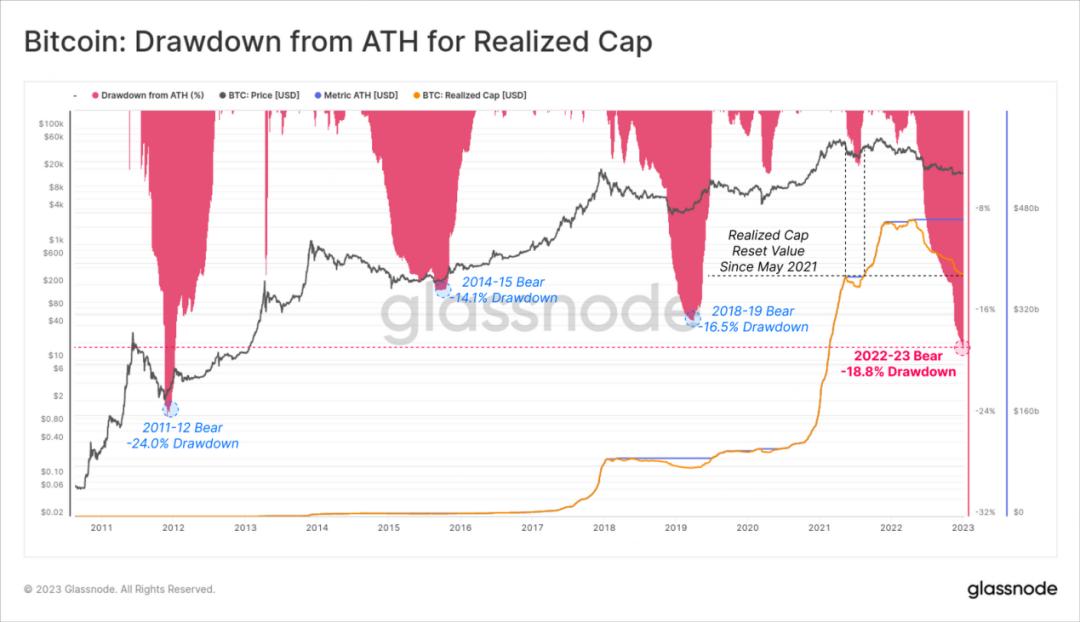
Bitcoin: Realized Cap Drop from ATH
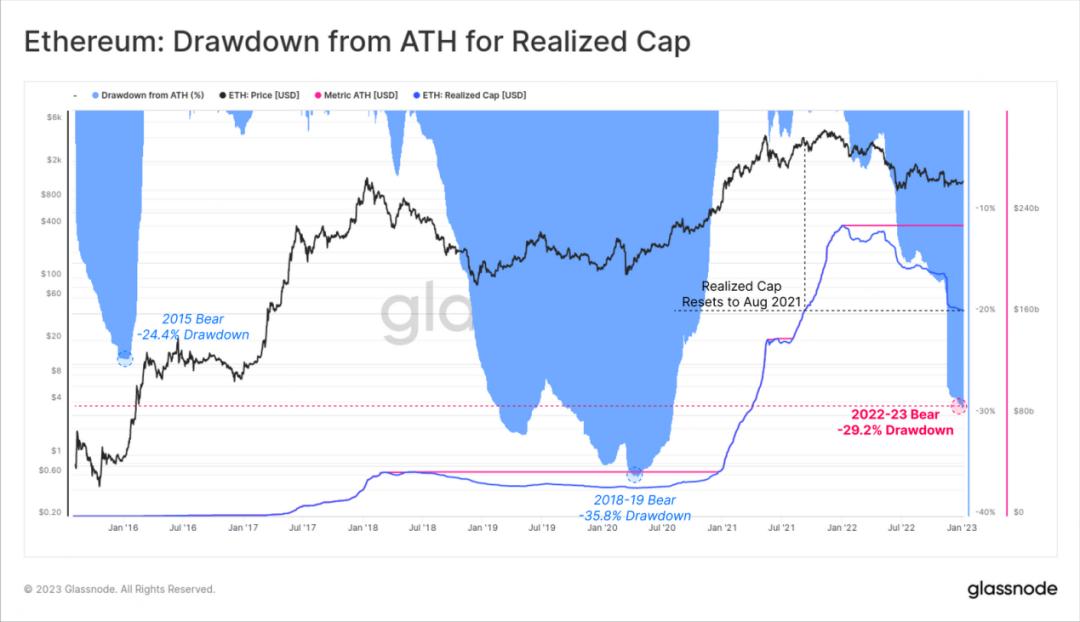
The relative shrinkage of Ethereum's market cap is even greater, with Ethereum's realized cap declining by -29.2% since its ATH in January 2022. Ethereum holders locked in a total of $67.1 billion in net realized losses during 2022.
This has also made the current bear market the most severe in terms of realized losses in history, although the relative scale has not yet reached the 35.8% decline of the 2018-19 bear market.
Ethereum: Realized Cap Drop from ATH
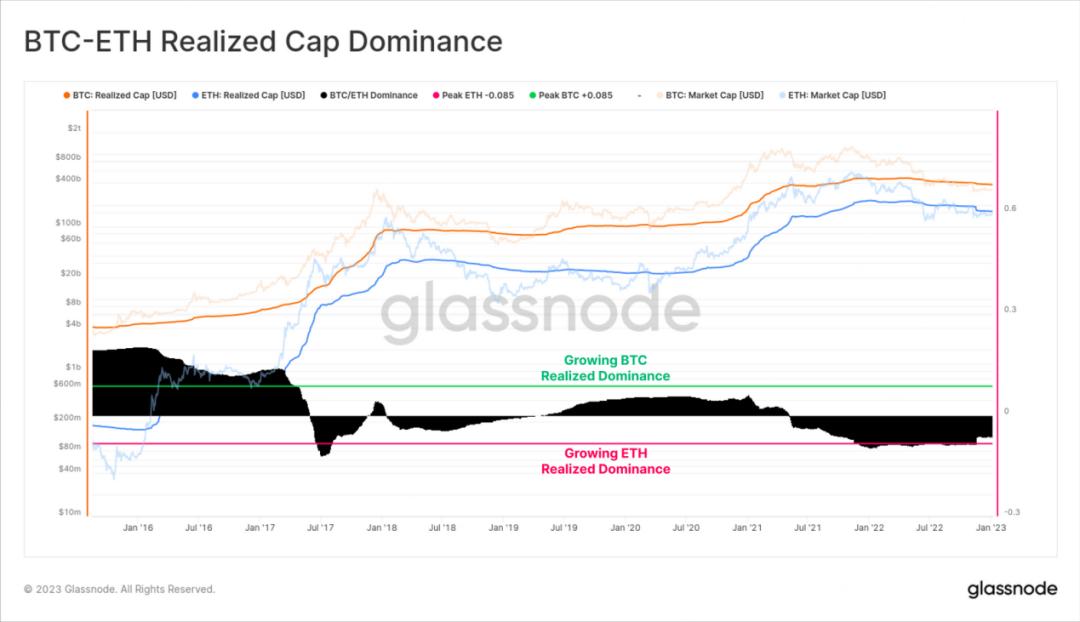
Finally, we have provided a new interpretation of the "market cap ratio" metric, aimed at addressing some of the drawbacks associated with the previously mentioned market cap ratio. The widely used "Bitcoin market cap ratio" metric has the main issue that the market cap of relatively illiquid tokens can be easily manipulated (e.g., FTT and other tokens supported by FTX). Therefore, entities holding large but illiquid stakes support inflated book valuations, which differ significantly from the actual market.
The model below illustrates the simplest realized market cap ratio. It is designed to track the relative structural capital inflows/outflows between the two main and most liquid digital assets, BTC and ETH.
This tool and principle can be applied to any token to track structural changes in ratios, better reflecting actual capital flows and discounting illiquid supplies (e.g., unallocated tokens, protocol treasuries, or lost supplies).
Bitcoin-Ethereum Realized Cap Ratio
Conclusion
The end of 2022 has seen a very calm cryptocurrency market, but this situation generally does not last long. Past instances of low volatility for Ethereum and Bitcoin typically occur before extremely turbulent market environments, with trading prices fluctuating widely in previous similar situations.
Although there was a brief warming after the FTX collapse, the on-chain activity of Bitcoin and Ethereum remains very weak. Using on-chain activity and the reduction of realized cap, it can be confidently stated that the realized cap has returned to levels seen in May 2021. This process has been painful for investors but has also brought market valuations closer to their fundamentals.
 Risk warning
 Risk warning