

BTC $63,009.14 +0.02%
ETH $1,878.46 -0.03%
BNB $605.30 -0.89%
XRP $0.9999 -0.40%
SOL $75.28 +0.04%
TRX $0.3310 -0.38%
DOGE $0.0696 -0.48%
ADA $0.1768 -1.54%
BCH $202.92 -1.21%
LINK $9.36 -0.78%
HYPE $57.05 +1.56%
AAVE $85.89 -1.01%
SUI $0.6738 -1.75%
XLM $0.1568 -1.43%
ZEC $485.98 -1.10%
BTC $63,009.14 +0.02%
ETH $1,878.46 -0.03%
BNB $605.30 -0.89%
XRP $0.9999 -0.40%
SOL $75.28 +0.04%
TRX $0.3310 -0.38%
DOGE $0.0696 -0.48%
ADA $0.1768 -1.54%
BCH $202.92 -1.21%
LINK $9.36 -0.78%
HYPE $57.05 +1.56%
AAVE $85.89 -1.01%
SUI $0.6738 -1.75%
XLM $0.1568 -1.43%
ZEC $485.98 -1.10%

Peter Brandt suggests that Bitcoin is showing a bullish pattern in the short term

2026-03-10 10:53:59

Renowned trader and chart analyst Peter Brandt, who successfully predicted the Bitcoin crash in 2018, released a chart showing the "big banana" pattern, which represents a massive upward-curving channel on the long-term weekly chart (2014-2027).

The "small banana" pattern is a smaller similar curve currently forming around $69,000 on the daily chart. The arrow clearly points upward, indicating higher targets.
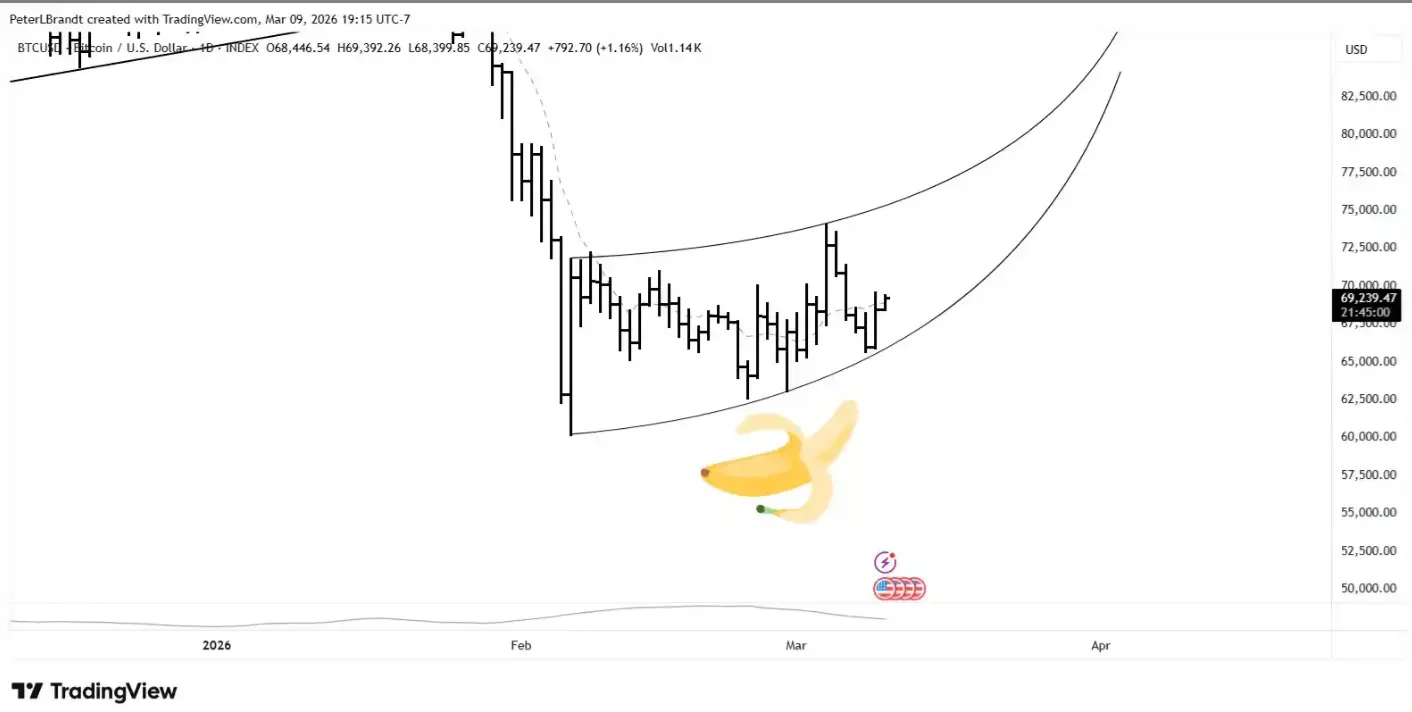
Peter Brandt suggests that Bitcoin is showing a bullish pattern in the short term

app_icon
ChainCatcher Building the Web3 world with innovations.