Interest rate hikes are not the killer of technology; EPS is: A strategy of retaining the strong after the major drop in the AI sector

 The plunge on June 5th felt more like "picking someone up in reverse" rather than "car crash with casualties."
Investment Summary
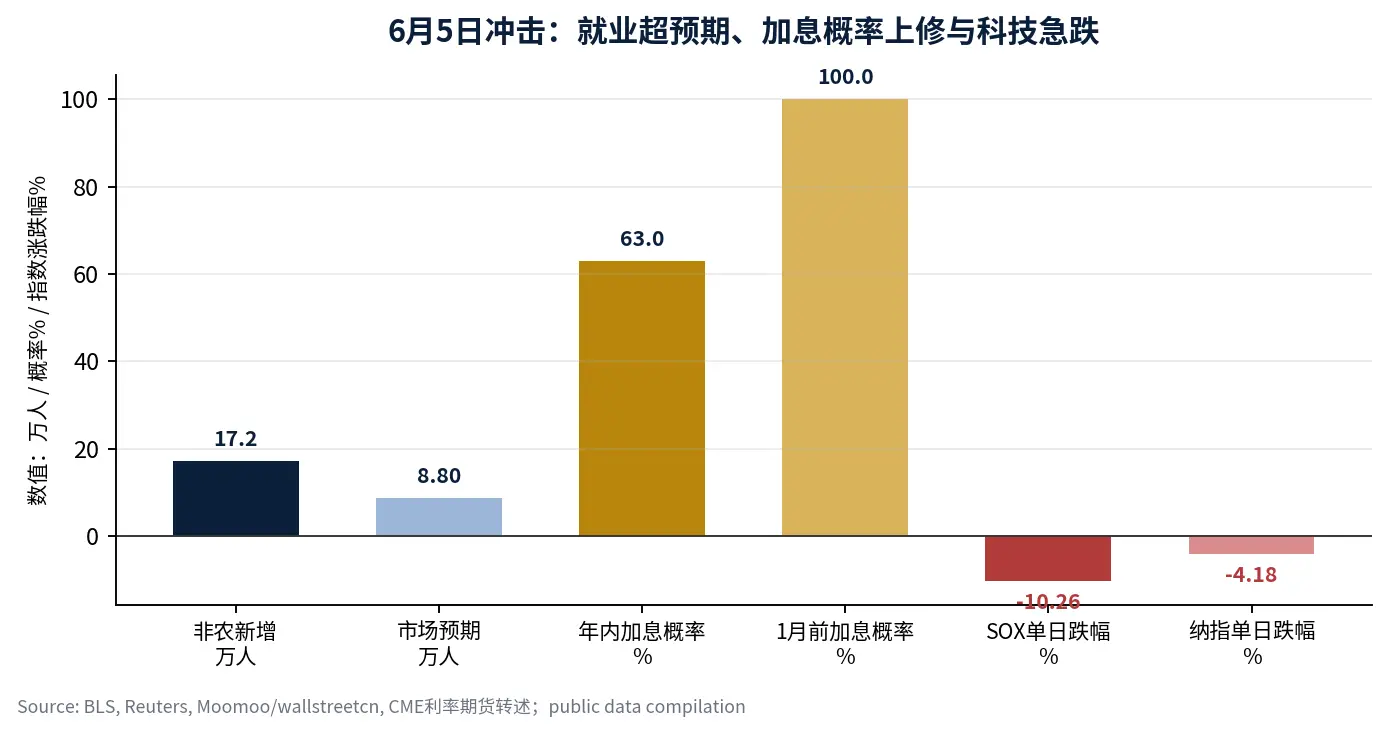
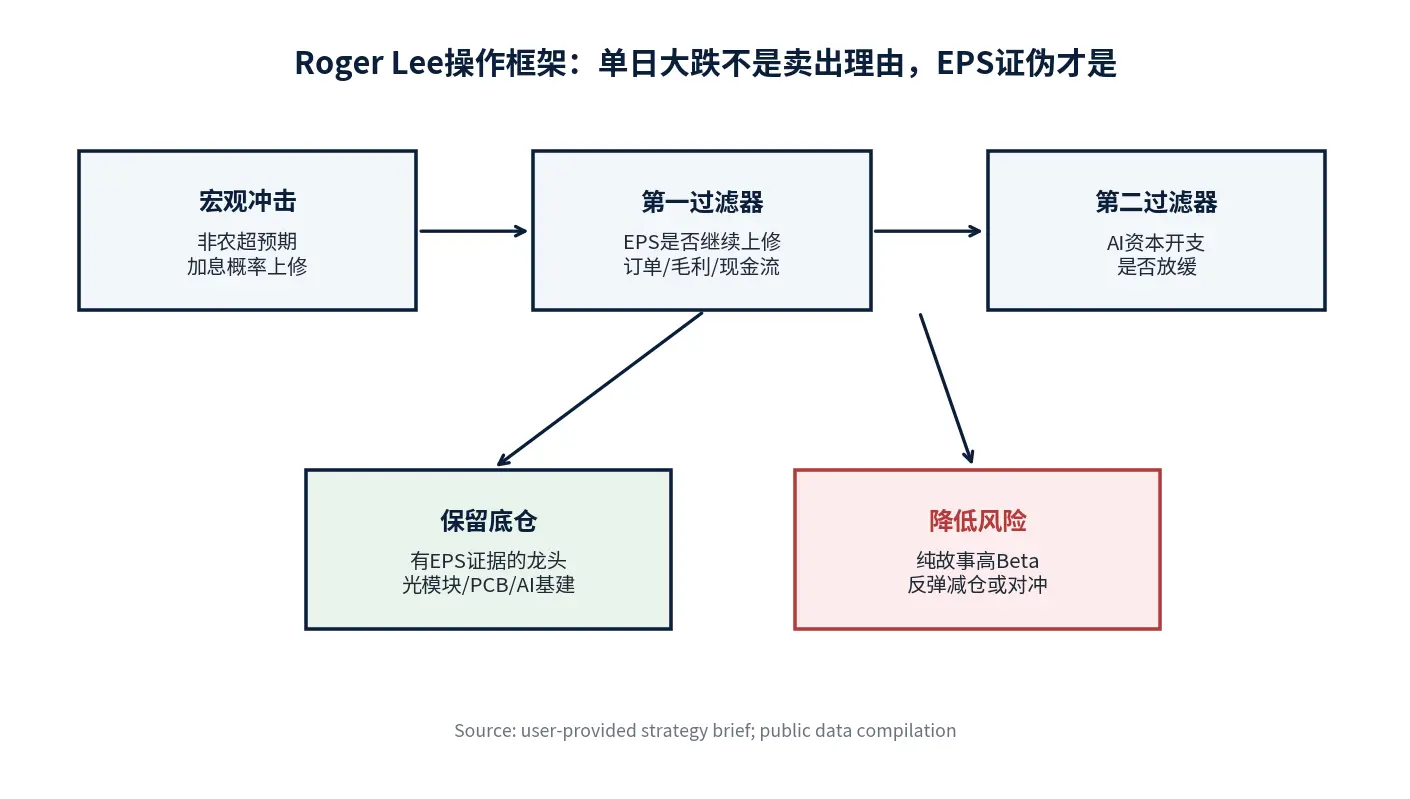
My conclusion is simple: the true end of the tech market is not the Federal Reserve raising rates by 25bp, but rather industry involution and EPS disproof; before these two signals appear, the drop on June 5th feels more like "picking someone up" rather than "a total disaster." This statement is the main thread of this report and also my positioning principle in dealing with the panic of this round of interest rate hikes. The U.S. added 172,000 non-farm jobs in May, significantly higher than the market expectation of 88,000, prompting the market to revise the probability of rate hikes this year to 63%, nearly 100% before January next year. The Philadelphia Semiconductor Index dropped more than 10% that day, and the Nasdaq fell 4.18%. However, I will not abandon the tech narrative because of a single macro data day, as historically, what truly determines whether tech stocks can withstand interest rate disturbances has never been the rates themselves, but whether EPS is still being revised upward.[1] [2]
My judgment is that AI trading has transitioned from "broad-based rally narrative" to "narrow circle validation." This is not a phase where all high-beta tech stocks can be indiscriminately bought, but it is also not a phase where the AI narrative has ended. The core positions should be reserved for leading assets with high order visibility, stable gross margins, strong cash flow quality, and where EPS can still be revised upward by analysts; for quantum, aerospace, and some small chip story stocks lacking a profit closure, positions should be reduced during rebounds, or options structures should be used to hedge portfolio volatility.
I. Fact Judgment: Interest Rate Panic is a Trigger, Not the Main Cause
The market reaction on June 5th was very intense, but the triggering chain is not complicated. Official data from the BLS shows that U.S. non-farm employment increased by 172,000 in May, with the unemployment rate holding steady at 4.3%, and employment for March and April revised upward by 93,000; strong employment data reinforced market concerns about inflation stickiness and further rate hikes.[3] Reuters and market reports indicate that the Nasdaq fell 4.18% that day, and the Philadelphia Semiconductor Index (SOX) dropped more than 10% in a single day, as investors quickly repriced risk assets into a scenario of "higher rates for longer." [1] [2]
|----------|-------------------|---------------------------| | Variable | Changes Before and After June 5th | My Interpretation | | U.S. May Non-Farm Employment | 172,000, significantly higher than the expected 88,000 | Short-term repricing on the rate side, but employment structure still needs to be viewed through wages and inflation transmission | | Unemployment Rate | 4.3%, unchanged from the previous value | The labor market has not deteriorated in a recessionary manner, rather it suppresses rate cut expectations | | Probability of Rate Hikes | Market revised up to 63% | Creates valuation pressure on duration assets, initially hitting overvalued tech | | SOX Index | Single-day drop of over 10% | Semiconductors are at the core of crowded trades, initially impacted by liquidity | | Nasdaq | Single-day drop of 4.18% | Panic is evident at the index level, but does not equate to AI EPS being disproven |
I define this drop as a concentrated release of rate shocks combined with crowded trading. It will eliminate parts of valuations that have expanded too quickly and will force funds to withdraw from weak logic, high elasticity, and low profit certainty varieties; however, if AI infrastructure orders, cloud vendors' capital expenditures, and demand for GPUs/optical modules/PCBs do not show substantial downward revisions, the tech narrative will not end because of this day's drop.
II. Historical Review: The Lesson from 1999 is Not "Chasing Bubbles," but "Watching EPS"
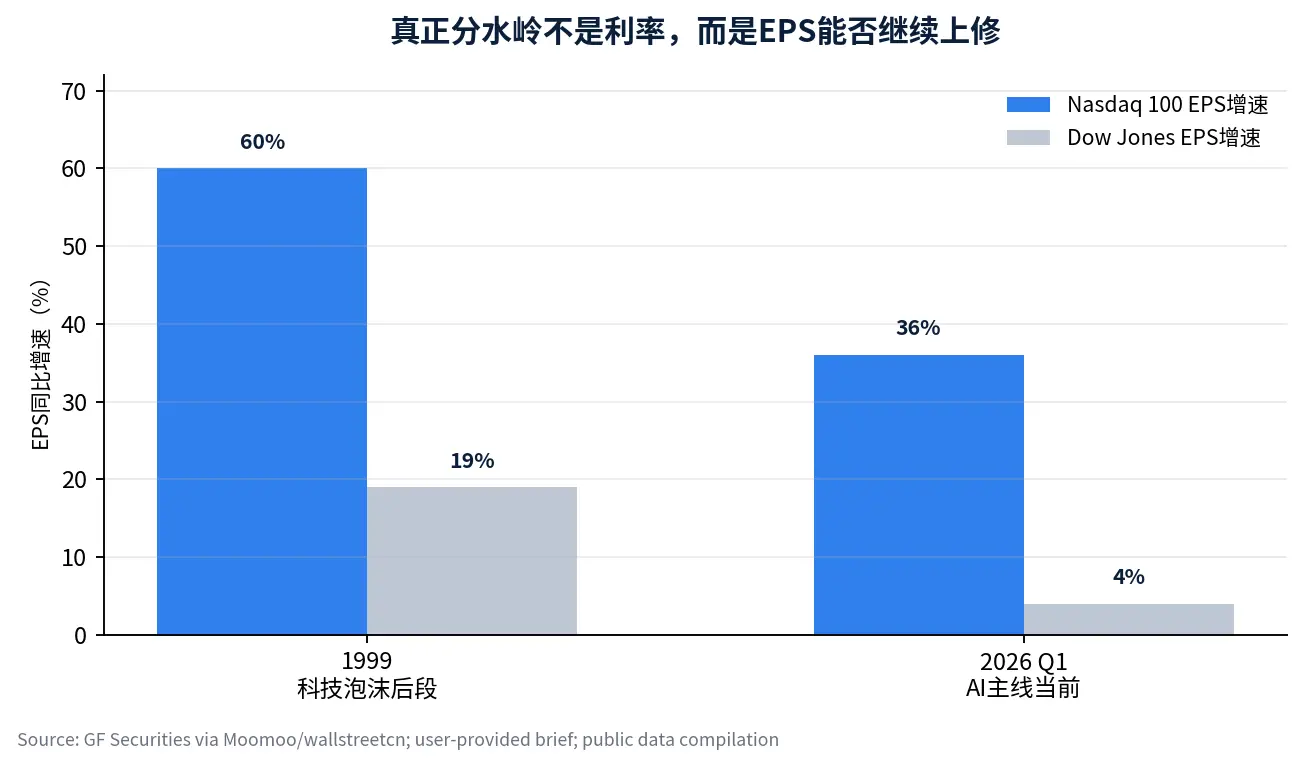
The tech bubble period of 1999 is often used to warn today's tech stocks, but I believe this analogy should not only focus on valuations but must also consider earnings. At that time, the Federal Reserve entered a continuous rate hike cycle, the Dow Jones was generally flat, while the Nasdaq continued to rise significantly until it peaked in March 2000. Research cited by Moomoo mentions that in 1999, Nasdaq 100 EPS grew by about 60%, while Dow EPS growth lagged significantly; by Q1 2026, Nasdaq 100 EPS growth was about 36%, and Dow about 4%, with a re-emergence of earnings differentiation structure.[2]
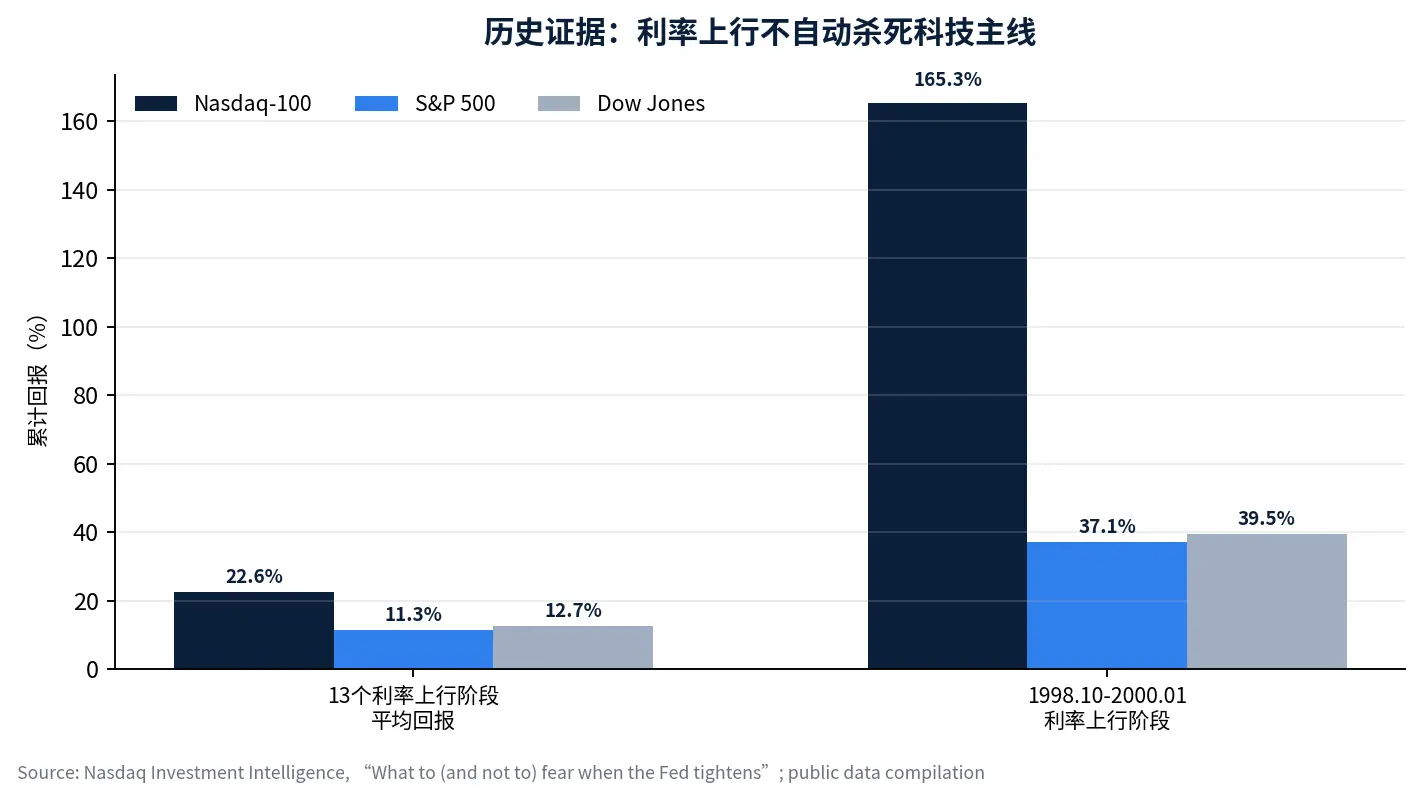
Nasdaq Investment Intelligence's research on the past 30 years of interest rate upturn phases also supports the same conclusion. In the 13 phases of interest rate increases lasting at least 6 months from 1985 to 2021, the average cumulative return of the Nasdaq-100 was 22.6%, higher than the S&P 500's 11.3% and the Dow's 12.7%; during the phase from October 1998 to January 2000, when the 10-year U.S. Treasury yield rose by about 2.2 percentage points, the Nasdaq-100 cumulatively rose by 165.3%, significantly outperforming the S&P 500 and Dow during the same period.[4]
This historical period teaches me that it is not "high valuations can rise forever," but rather that interest rates are not a sufficient condition for selling tech stocks. The real danger lies in two things: first, stock prices rely solely on PE expansion without EPS keeping pace; second, the competitive landscape of the industry begins to deteriorate, with leading gross margins and cash flows turning downward. If these two things do not happen, rising interest rates are more about adjusting the rhythm rather than directly declaring the main narrative dead.
III. Valuation Framework: Short-term Focus on Prosperity, Long-term Focus on Margin of Safety
I do not agree with mechanically judging whether AI leaders are in a bubble based on a single PE or PB percentile. In the short-term, over a one-year dimension, stock prices are mainly determined by revenue growth rates, changes in ROE, and the direction of EPS revisions; over a three to five-year dimension, PB, free cash flow yield, and capital return cycles will truly determine long-term returns. Research from Pacer ETFs shows that at the end of 1999, the Nasdaq-100 had a PE of about 73 times earnings, with a free cash flow yield of only 0.76%; while by the end of 2023, it was about 31 times earnings, with a free cash flow yield of 2.68%. The current leading companies' sales, profits, and free cash flow scales are also incomparable to those of internet bubble companies in 1999.[5]
|-----------|-----------|------------------------------------| | Valuation Issue | Misconception | My Judging Method | | Is high PB necessarily a bubble? | Just because PB is high means it's a bubble | Look at ROE, technological barriers, capital expenditure return rates, and EPS upward revision direction | | Is high PE necessarily a sell? | Reduce positions just because PE percentile is high | If EPS continues to be revised upward, high PE may be digested by earnings; if EPS stagnates, high PE is dangerous | | Is AI leadership too crowded? | Crowding equals peak | Crowding is more like a signal of narrowing circles, with funds moving from weak assets back to strong assets | | How to handle rising interest rates? | Sell all tech | Reduce leverage, keep strong, and retain the strongest bottom positions with EPS evidence |
Therefore, I will categorize AI core assets into two types. The first type includes "toll booth assets" with real orders, real gross margins, and real cash flows, including AI server chains, advanced packaging, optical modules, PCBs, and core suppliers of cloud capital expenditures. The second type includes high-beta assets that only tell long-term stories with unclear paths to profitability, such as some quantum, aerospace, conceptual chips, and software stocks lacking order validation. The former should be observed for accumulation windows during significant drops, while the latter should reduce risk exposure during rebounds.
IV. Crowding: This is a Narrowing Circle, Not the First Peak
Current funds are clustering around AI core assets, siphoning off dividends, small market caps, and non-core assets, which must be acknowledged. However, crowding itself does not equate to a peak. A true peak often needs to meet three conditions simultaneously: first, marginal slowdown in industry capital expenditures; second, deterioration in the competitive landscape of leading companies, with price wars or gross margin declines beginning to appear; third, the trend of EPS upward revisions stops or even turns downward. So far, this round of adjustment aligns more with the characteristics of "left-side phase high cuts low" and "main narrative narrowing" rather than confirming the first mid-term peak of AI.[2]
I view the late June to July earnings season as a true validation window. A-share mid-year report forecasts, U.S. tech stock Q2 earnings guidance, cloud vendors' capital expenditure metrics, and visibility of semiconductor supply chain orders will collectively determine whether this round of adjustment is a healthy turnover or if the main narrative is starting to enter profit disproof.
V. My Investment Interpretation: Do Not Abandon the Tech Narrative, but Must Keep the Strong and Remove the Weak
My operating principle is: core positions are reserved for leading companies with EPS evidence, and risk budgets will no longer be wasted on high-beta varieties that only tell stories. In the AI infrastructure chain, I prefer to hold companies with high order visibility, stable gross margins, good cash flow, and that are in the rigid segments of customer capital expenditures. Optical modules, PCBs, AI servers, advanced packaging, cloud infrastructure, and software platforms with bargaining power are the directions I am willing to endure volatility.
|--------------|-------------|-------------------------|----------------| | Asset Category | Current Action | Core Reason | Risk Control | | AI Infrastructure Leaders | Retain core positions, observe in batches during sharp declines | EPS and orders still have evidence, short-term rate shocks do not change industry trends | Do not chase high, wait for key nodes to materialize | | Optical Modules/PCBs/Advanced Packaging | Maintain core focus | AI server capital expenditures transmit most directly to the hardware chain | If gross margins or orders are revised downward, immediately reduce weighting | | Cloud and Platform Software | Choose strong ecological moats | AI application entry points and enterprise refresh cycles still have long-term value | Prevent excessive front-loading of valuations | | Quantum/Aerospace/Some Conceptual Chips | Reduce positions during rebounds | Strong narrative, weak EPS, most easily killed in valuation during rising interest rates | Options can be used to hedge high-beta exposure | | Dividend and Cash-like Assets | As a portfolio stabilizer | Hedge against macro node uncertainties | Do not treat defensive positions as long-term narratives |
This is not blind optimism. On the contrary, I believe that in the coming month, it is necessary to closely monitor four nodes: June 10 CPI; if core inflation exceeds expectations due to oil price transmission, leverage needs to be reduced; oil prices and the U.S.-Iran situation; if oil prices remain high for a long time, it will increase inflation stickiness; mid-June ECB and BOJ meetings will affect global liquidity; June 18 comments from Waller, if phrased extremely hawkishly, will reshape interest rate path pricing. Macro nodes determine rhythm, EPS determines direction.
VI. Conclusion: Picking Up Passengers, But Only Those with Performance
I will not abandon the tech narrative because of the single-day drop on June 5th, but I will upgrade the portfolio from "buying AI stories" to "buying AI profit statements." If a company can prove that orders, gross margins, cash flows, and EPS continue to be fulfilled, its drop during interest rate shocks feels more like an opportunity; if a company only has concepts without a path to profitability, it should be reduced during rebounds.
The final conclusion remains the same as the opening statement: the true end of the tech market is industry involution and EPS disproof, not the Federal Reserve raising rates by 25bp. The current adjustment is "picking up passengers," not "a total disaster"; maintain positions with performance and wait for the four major nodes to materialize.
This report is compiled by a special analyst. The views expressed in this report represent the author's personal stance and do not represent the views of the BIT platform. This material is for reference only and does not constitute investment advice.
References
Reuters, Nasdaq, S&P futures slip as semiconductors drag, payrolls in focus, June 5, 2026.
Moomoo / Wallstreetcn, Persistent headwinds from crowding, valuations, and interest rate hike expectations: Is tech still worth holding?
U.S. Bureau of Labor Statistics, The Employment Situation --- May 2026.
Nasdaq Investment Intelligence, What to and not to fear when the Fed tightens.
Pacer ETFs, The NASDAQ-100: Is this time really different?
Northwestern Mutual, The Fed Is Raising Rates: Here's How Markets Have Performed in the Past.
 Risk warning


Popular articles