




NVIDIA fell 9%, AppLovin rose 56% in a week: After the AI crash, what should you check in your account?
The Nasdaq index recorded its largest single-day drop since April 2025, with AI hardware, cryptocurrency assets, and overvalued growth stocks all under pressure. This round of adjustment truly highlights the gap: companies with cash flow and performance will behave completely differently in the next round of volatility compared to those that only have stories.
1. AI has not disappeared; the market is just starting to differentiate assets
On November 5, the Nasdaq fell 5.52% in a single day, marking its largest single-day drop since April 2025. The Philadelphia Semiconductor Index dropped by 12.25%, with AI hardware, semiconductors, and overvalued growth stocks facing concentrated sell-offs, resulting in a loss of approximately $3 trillion in market capitalization for U.S. stocks in one day. According to Wall Street's common measure, a 10% pullback from a high point is considered a technical correction, while a 20% pullback is deemed a technical bear market. The Nasdaq's drop has already crossed the first line, retreating about 12% from the historical high on October 6. The VIX index, which measures panic levels, surged nearly 70% on the same day, rising above 28. Panic itself does not convey information; it is the stratification of prices that carries information. If one only looks at the index, it is easy to conclude that the AI market has ended. However, looking at the performance of individual stocks in the same week reveals that the information conveyed by the market is not that simple.
AppLovin surged 31% in pre-market trading after its earnings report and closed up 9.86% on November 6, accumulating nearly a 56% increase for the week. Cloudflare also strengthened due to better-than-expected performance and an upward revision of its full-year profit guidance. Meanwhile, Bitcoin briefly fell below $76,000, and stocks related to digital assets generally faced pressure, while new strong varieties emerged in the pharmaceutical sector.
The market did not sell off all risk assets; what it is really doing is distinguishing the quality of growth: Does a company truly convert AI into revenue and profit? How much capital is invested for this revenue? How much debt is needed for expansion? If the financing environment tightens, can cash flow still hold up?
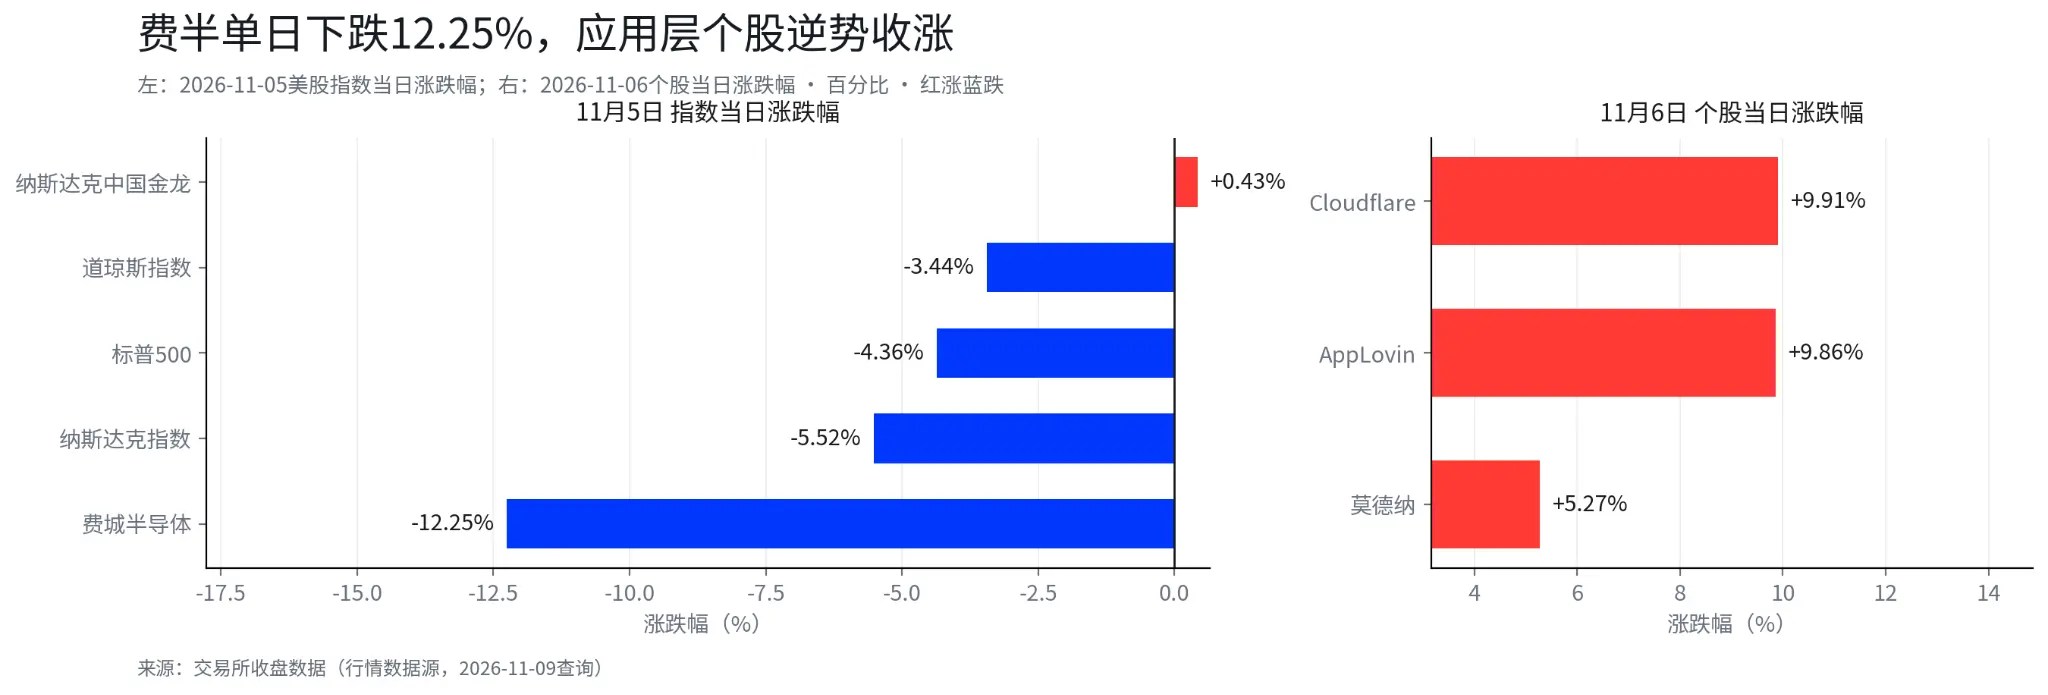
Caption: In the same trading week, the Philadelphia Semiconductor Index fell 12.25% in a single day, yet AI application companies AppLovin and Cloudflare rose against the trend, indicating that the "AI trade" has already differentiated internally.
Over the past year, the biggest advantage of the AI industry chain has been rapid growth, with the market willing to assign valuations upfront. Now, this logic is undergoing a stress test. Among AI concepts, some companies can directly convert technology into profits, while others require continuous massive capital investments to maintain expansion, leading to a natural divergence in stock performance. The market has not suddenly stopped believing in AI; it is simply asking a more realistic question: Is this company making money from AI, or is it relying on the capital market's belief that it will make money in the future? For ordinary investors, rather than guessing daily whether the AI bull market has ended, it is better to use this adjustment to re-examine their holdings, because when the next round of market activity starts, funds may not necessarily buy back all AI assets, and companies with real profitability, cash flow, and order support are more likely to be favored.
2. First Check: Is your holding truly generating cash flow or still burning money?
One of the most obvious differentiations in this round of adjustment is that the market has begun to re-evaluate the cash flow of heavy asset AI infrastructure. In the past, data centers, GPU leasing, and computing power infrastructure benefited from the rapid growth of AI demand, and the financing environment was relatively loose, with the market willing to pay high valuations for expansion speed. However, when investors begin to worry about interest rates, financing costs, and capital expenditures, the other side of the heavy asset model will be exposed: faster revenue growth does not necessarily mean better free cash flow. Building data centers, purchasing GPUs, and expanding computing power require significant upfront investment, and if the cash generated from operations is insufficient to cover capital expenditures, the company may continue to rely on bond issuance or equity financing. In a favorable financing environment, this model can expand rapidly. Once financing costs rise, valuation contractions often become more pronounced. This logic was concentratedly realized on November 5 (see Figure 2).
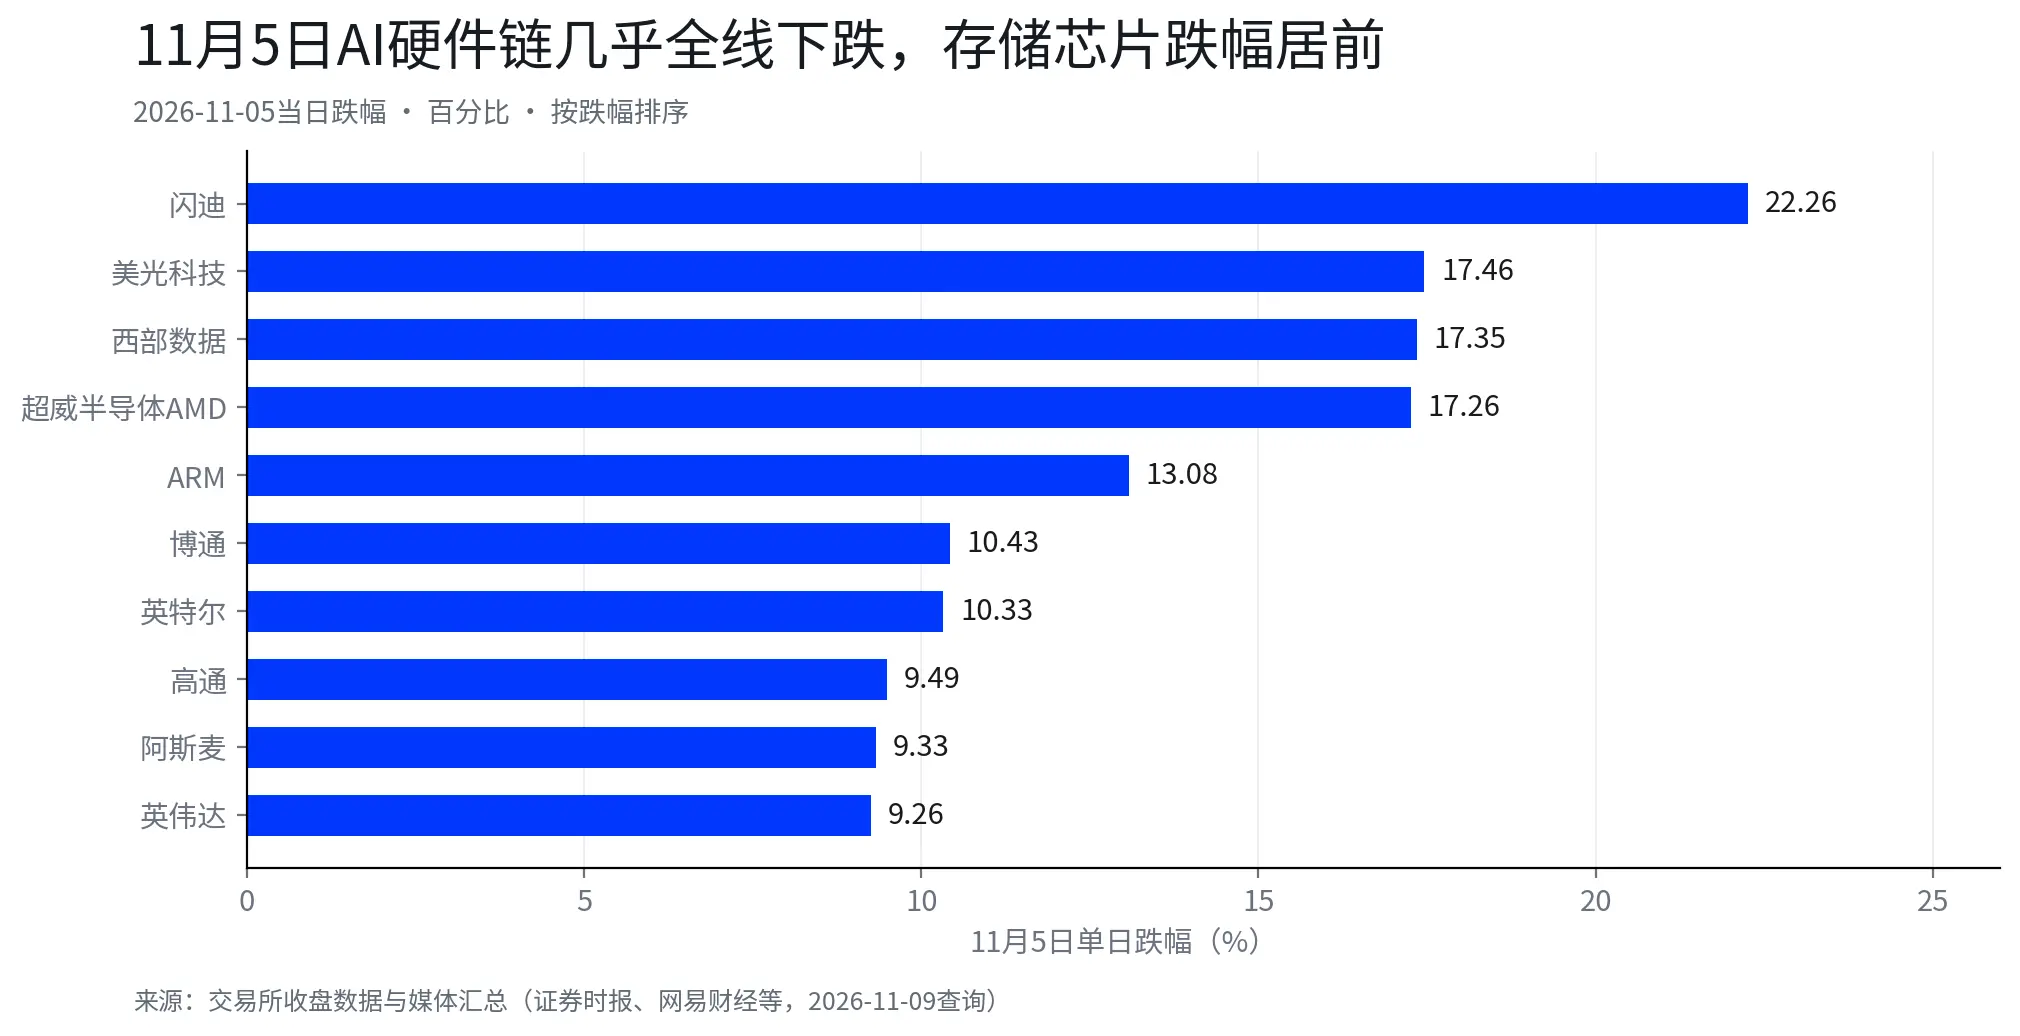
Caption: On that day, no hardware stocks closed up; the hardest hit were storage and previously overvalued chip stocks, where crowded positions were the first to feel the pressure in the sharp decline.
CoreWeave is a case worth observing (see Figure 3). According to the company's quarterly report for the first half of 2026, its operating cash flow totaled approximately $3.663 billion, but free cash flow remained negative at -$10.454 billion, indicating that while operating activities generated cash, there was still a significant funding gap after deducting capital expenditures. In contrast, AppLovin and Cloudflare were given more positive pricing by the market, largely because their growth could be more directly reflected in revenue, profit, and operational leverage. AppLovin applies AI capabilities to advertising and monetization, while Cloudflare drives growth in cloud services and cybersecurity through AI-related demand. When the market shifts from "looking at stories" to "looking at realizations," this difference will quickly reflect in stock prices.
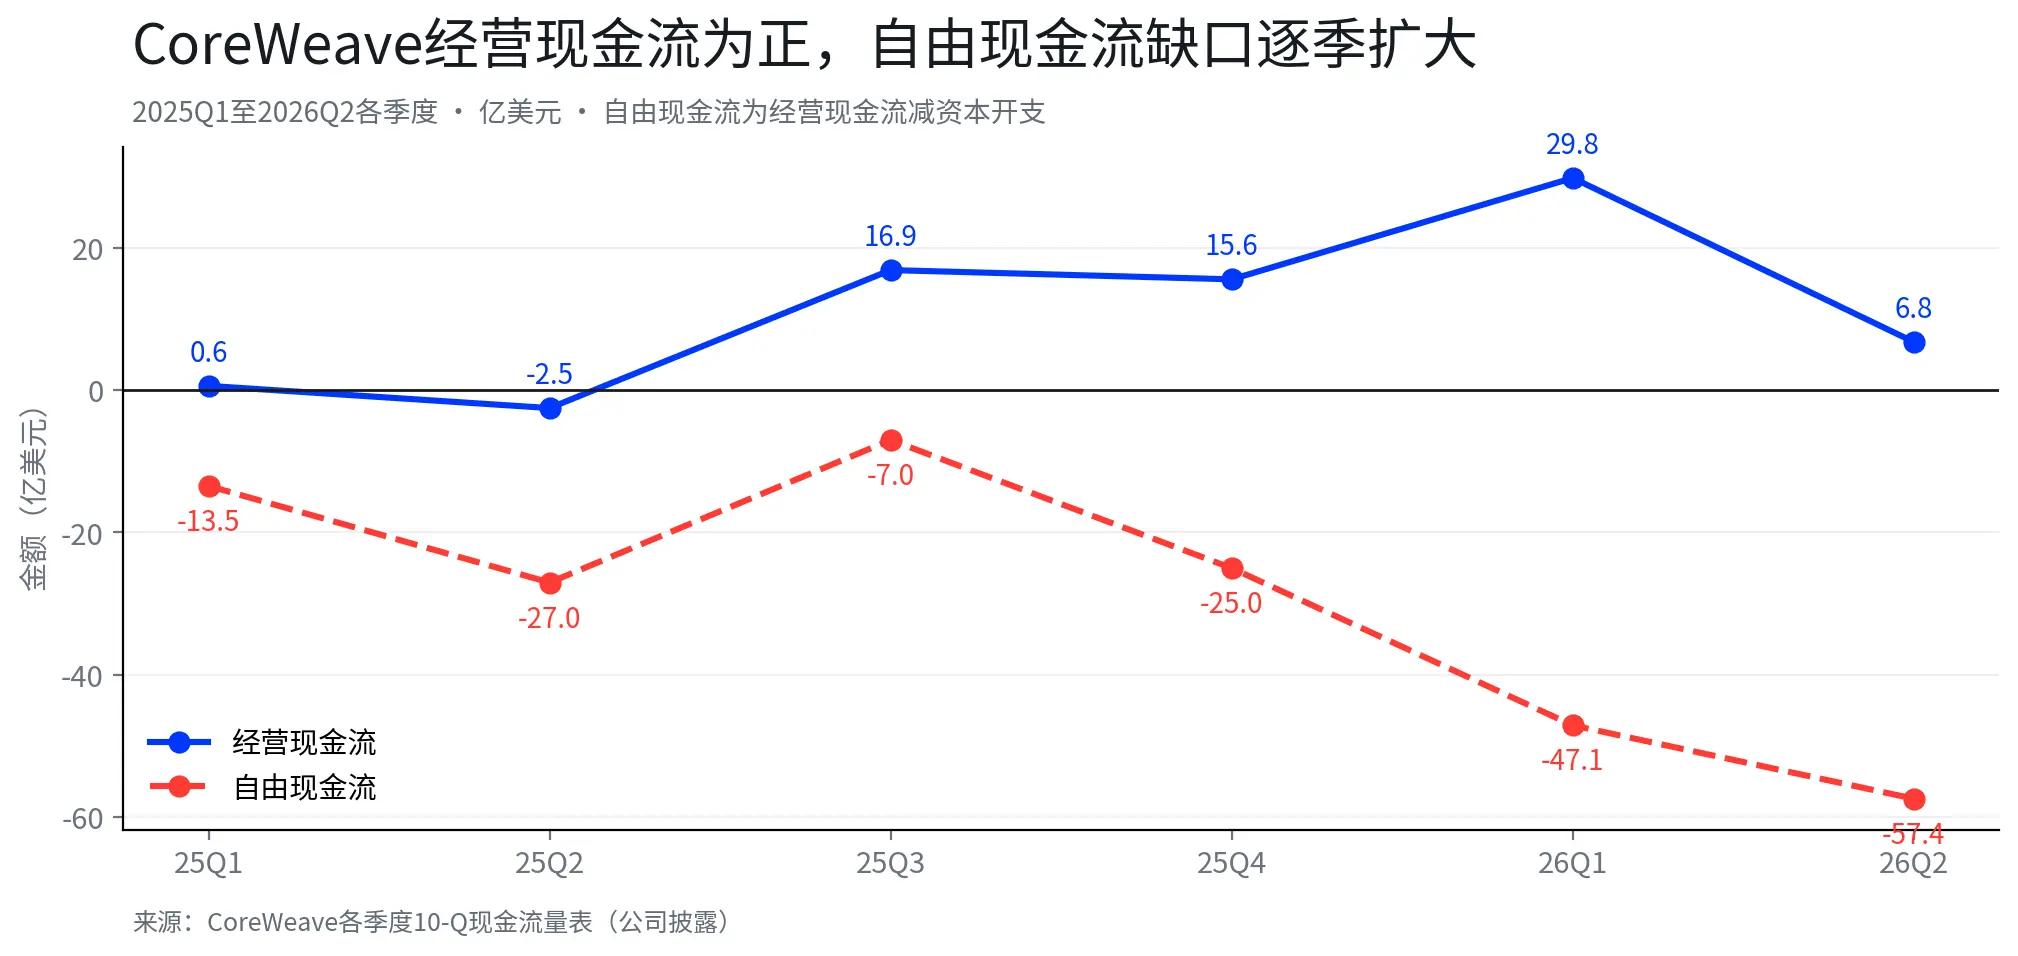
Caption: CoreWeave's operating cash flow (blue line) has been continuously positive, yet the gap in free cash flow (red line) has been widening quarter by quarter, with expansion primarily relying on bond issuance and equity financing.
Checking holdings does not require re-reading dozens of pages of financial reports; one can first look at three indicators: operating cash flow, free cash flow, and interest-bearing debt. Continuous positive operating cash flow indicates that the main business can generate cash. A gradually narrowing free cash flow gap means the company is improving its self-financing ability. If revenue and orders are growing rapidly, but free cash flow remains significantly negative for a long time and requires continuous bond issuance or equity financing, then the company's dependence on the external funding environment is higher. Practically, open the company profile page in the trading software, scroll to the cash flow statement, and jot down the net operating cash flow and capital expenditures for the last eight quarters; subtracting these gives the free cash flow. Drawing it as a line will clearly show whether the gap is narrowing or widening. Companies that are burning cash for expansion are not without value; many great companies in history have burned money for many years. The difference lies in whether the money spent can turn into future cash flow. What needs to be clearly understood is what risks one is taking: if a large portion of the account is concentrated in high capital expenditure and high financing requirement AI infrastructure companies, once the market reassesses financing costs and investment returns, the portfolio may experience volatility far beyond expectations. The debt structure indicates the same thing: CoreWeave has a total of $20.65 billion in debt maturing over the next five years, with $10.59 billion due in 2026 and 2027 alone; refinancing is not a test for a particular year but a routine topic for the next five years (see Figure 4).
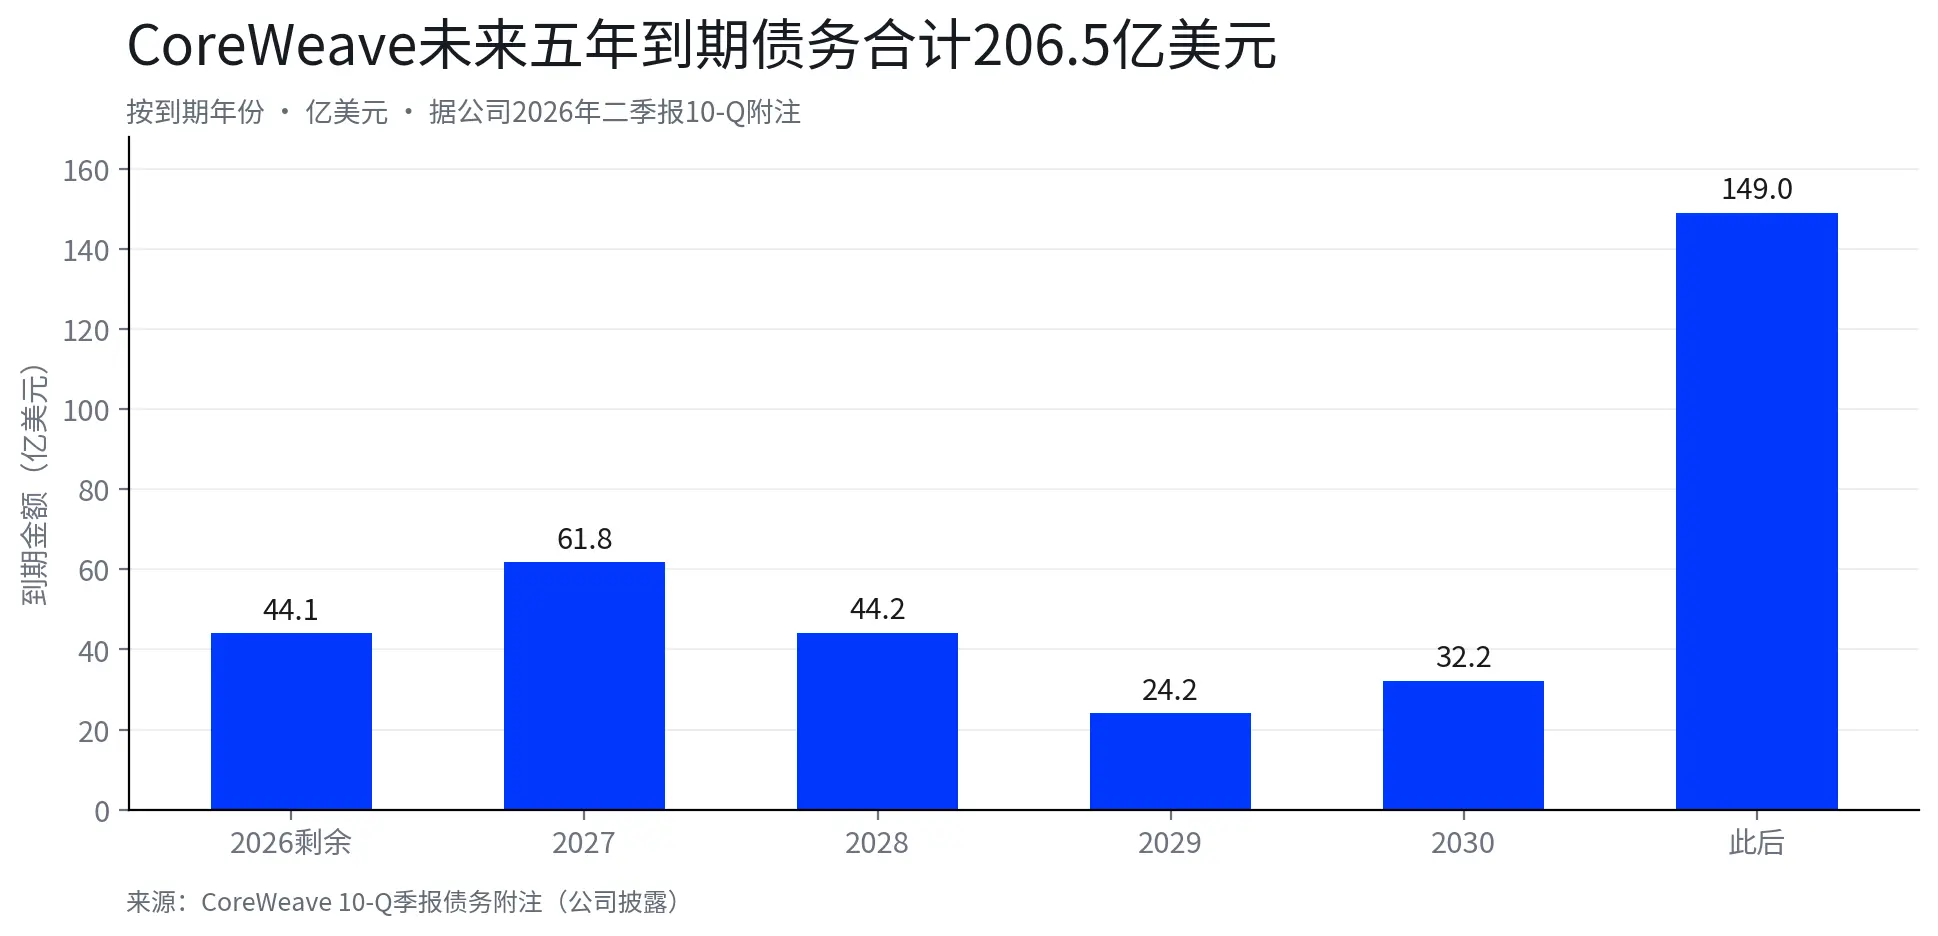
Caption: There are bond maturities every year for the next five years, and the pressure of refinancing is ongoing, which is another side of the free cash flow gap.
3. Second Check: You think you have bought many assets, but in reality, you may have only bought one story
Many investors' real problem is not having too few holdings; a more common situation is that they appear diversified but are actually highly correlated. An account may simultaneously hold AI chips, computing power leasing, data centers, cloud computing, robotics, along with Bitcoin and stocks related to digital assets. Their names and businesses are different, but the underlying funding sources may be highly consistent: interest rates, liquidity, risk appetite, and AI capital expenditures. When these factors change, different assets may be impacted simultaneously. This is why some investors, despite holding a dozen stocks, see their accounts almost retract together when the market falls; the diversification is merely in company names, not in sources of risk.
Last week's market clearly demonstrated this difference. On November 5, AI hardware and semiconductors fell sharply, Bitcoin weakened simultaneously, while some pharmaceutical assets experienced relatively independent increases. Moderna achieved its first quarterly profit in two years in the third quarter and raised its full-year revenue growth guidance, reaching a 52-week high during intraday trading on November 6. From September 8 to November 6, Moderna rose approximately 81%, while Bitcoin fell about 3.5% during the same period. More intriguingly, on the same day, the equal-weighted S&P 500 index rose 1.86%, setting a new closing historical high (see Figure 6). In the same U.S. stock market, the market capitalization-weighted index is falling, while the equal-weighted index is rising, indicating that the focus of the sell-off is quite concentrated, primarily affecting the largest weighted stocks. This does not mean that pharmaceuticals are necessarily better than cryptocurrency assets, nor does it imply that investors should swap all AI positions for defensive stocks; rather, it indicates that different assets have different pricing logic: some are more dependent on liquidity and risk appetite, while others are primarily driven by orders, profits, and product progress. When the market environment changes, they may not move in the same direction.
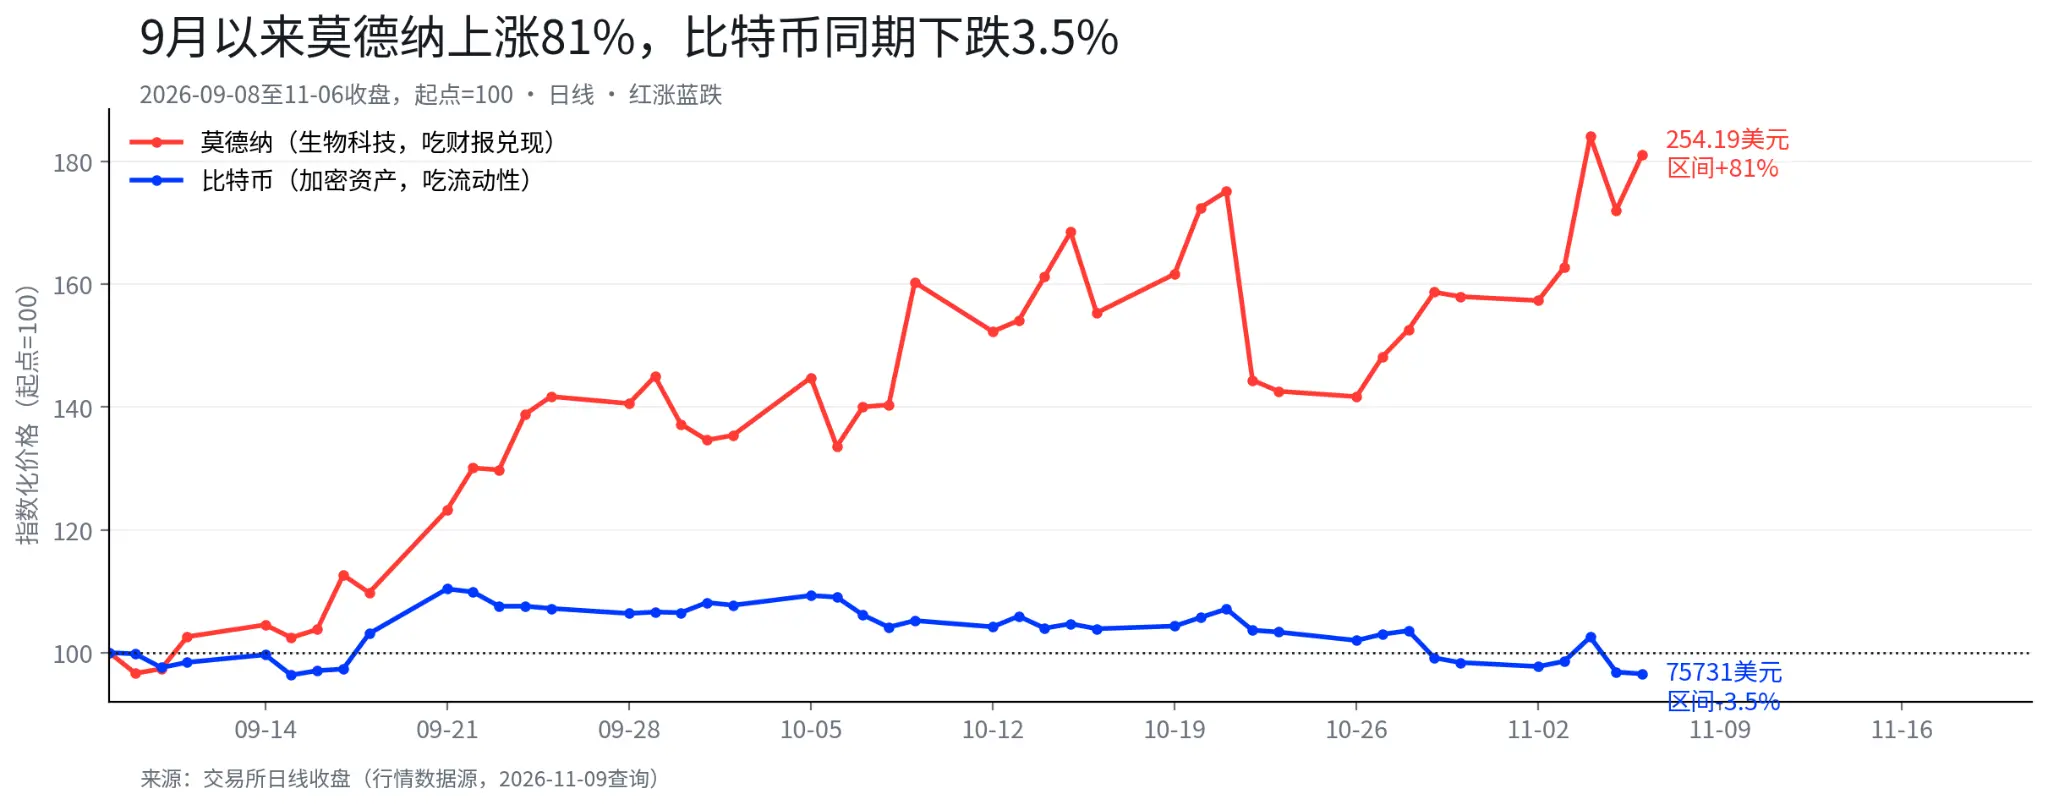
Caption: Since September 8, Moderna has risen 81%, while Bitcoin has fallen 3.5%. Both are "high-risk assets," one benefiting from earnings realization and the other from liquidity.
A more practical approach is to re-examine the account based on the driving factors behind the assets, rather than just looking at how many stocks are held. Which positions rely on AI capital expenditures, which depend on falling interest rates, which are influenced by consumer demand, and which primarily rely on the company's own profit growth? Write a sentence for each holding, noting its primary driver; positions that cannot be articulated are risks in themselves. Crowding can also create correlation; on November 5, even a storage leader with an operating profit margin of 80% saw a significant drop, with Micron down 17.46% and SanDisk down 22.26%. The first places to be hit in this round of sell-off were the most crowded and fully valued areas. If positions related to AI hardware, computing power, and cryptocurrency assets occupy a large proportion of the account, one should realize that they may be concentrating bets on the same macro direction rather than holding multiple independent investment opportunities. A truly healthy portfolio does not need to rise every day; the key is that when a particular theme temporarily fails, there are still other assets in the account that can support it. The significance of diversification is not to eliminate volatility; it prevents a single judgment error from determining the performance of the entire account.
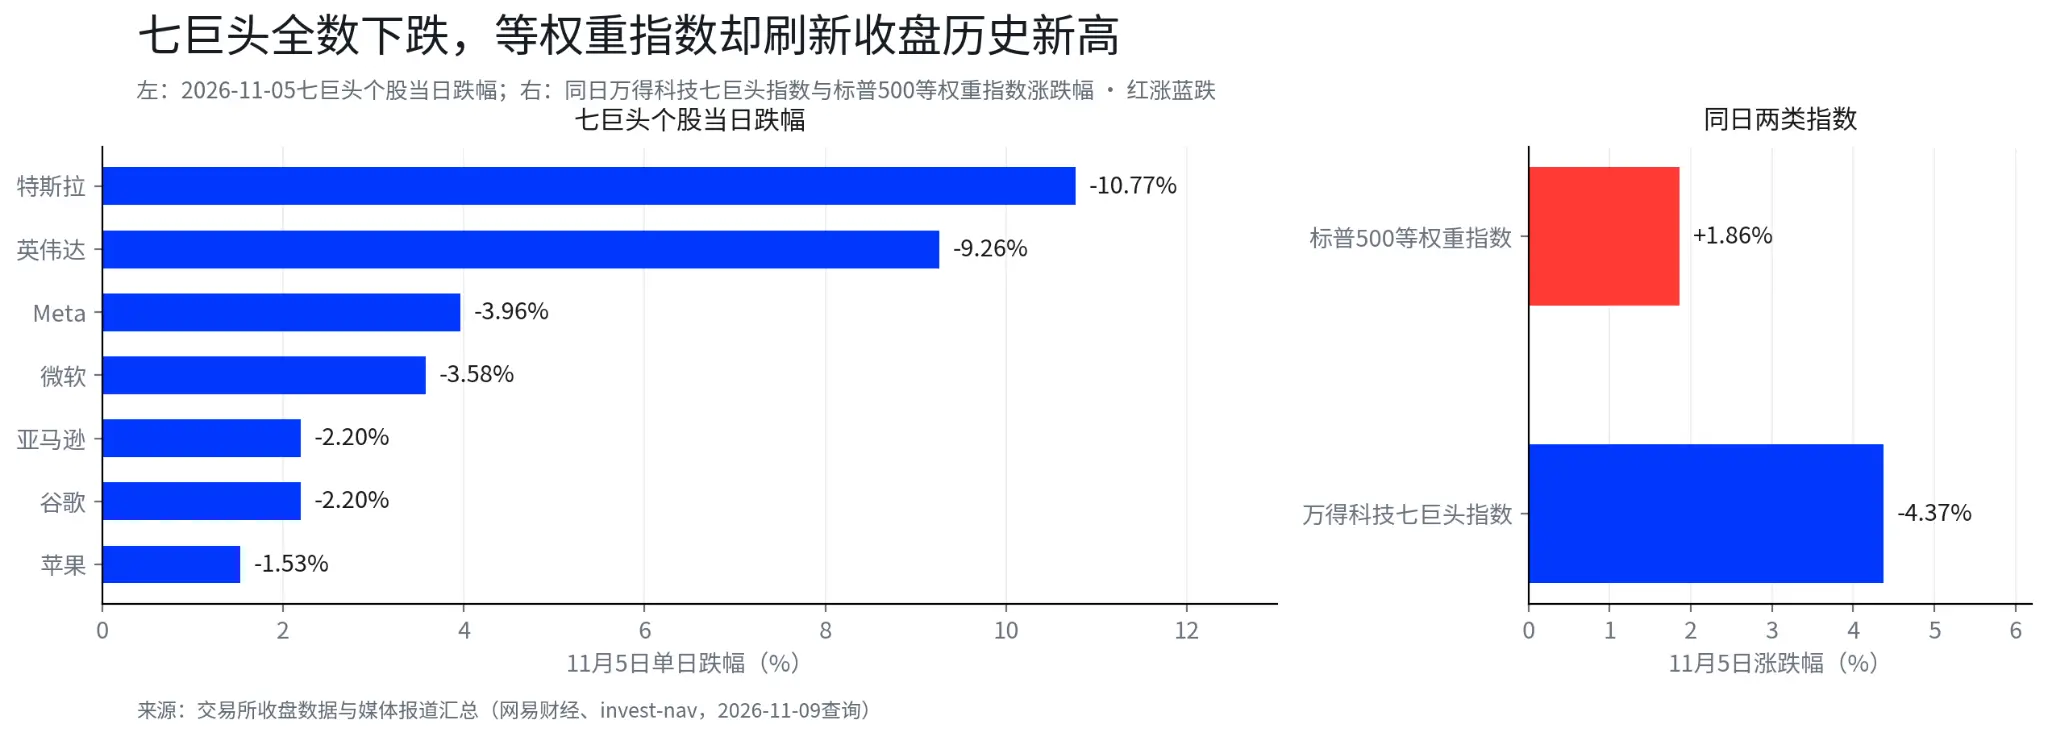
Caption: On the same day, all seven tech giants closed down, while the equal-weighted S&P 500 index set a new historical high, indicating that the focus of the sell-off was on the largest weighted stocks.
4. Third Check: When real opportunities arise, can your money move?
When the market crashes, many investors first think about whether they should buy immediately after the market drops. However, in actual trading, another situation often arises: the price has already fallen to the level of interest, but the funds have not yet arrived. Cash itself is also a type of position, and the efficiency of fund flow determines whether it is truly available cash. Suppose a company experiences a rapid reversal due to better-than-expected earnings reports, or the market suddenly drops 10% due to policy news; traditional cross-border wire transfers may take 1 to 3 business days. In a calm market environment, this seems like just an operational issue. But during periods dense with earnings reports, policies, and macro data, a few hours can mean completely different transaction prices.
Therefore, account health checks cannot only look at "how much money I have," but also at "how long it takes for this money to become tradeable funds." Where the funds are stored, how long it takes from initiating the transfer to being able to place an order, and what the cost of each transaction is—all of these should be clarified in advance. For users who meet applicable qualifications and jurisdictional requirements, BIT provides U.S. stock trading services and supports different funding methods such as stablecoins and traditional wire transfers. Under relevant rules and service conditions, stablecoin funds can be transferred 24/7 through on-chain networks, allowing users to arrange funds without being completely restricted by traditional bank operating hours and to prepare available funds in advance according to their trading plans.
Specifically, funds can be viewed in two layers: one layer is cash that can be ordered at any time in the account, and the other layer is a backup channel that is activated only when necessary. The focus of regular checks should be on the second layer; if it is not used, it should be ready to be used smoothly when needed. Of course, fast fund arrival does not mean that one should trade frequently, nor does it mean that one needs to buy immediately every time the market drops. The true value of fund efficiency is to ensure that investors do not miss execution opportunities due to funding channels after forming a clear trading plan. Trading ability includes not only the judgment of assets and prices but also position management, risk control, and execution efficiency. Instead of waiting until market opportunities arise to handle deposits, it is better to check fund arrangements in advance, allowing oneself to have choices when action is needed, rather than being forced to wait.
V. What Should Truly Remain After This Crash?
Every major drop creates a lot of noise: some say the AI bubble has burst, some believe this is a new golden pit, and others try to predict the direction for the next few months from a single day's candlestick. However, for ordinary investors, what is more valuable than predicting next week's ups and downs is to take advantage of market volatility to re-examine the account structure. Cash flow determines whether a company can weather cycles, diversification determines whether an account can withstand the failure of a single theme, and fund efficiency determines whether one can participate in opportunities in a timely manner. These three issues correspond to the three aspects of investing that are most easily overlooked: what to buy, how much risk to take, and whether there is the ability to execute.
It might be helpful to reopen your position sheet and supplement each position with three judgments: how it makes money, what factors it fears the most, and whether there are available funds in the account if an opportunity arises. Doing this is not about predicting that the market will definitely rise next, nor does it require investors to take action every time there is a pullback; rather, it makes risks concrete and gives each trade a clearer logic. The market will not stop AI investments because of a crash, nor will it end the long-term opportunities in crypto assets due to a pullback; what changes is that funds begin to choose assets more selectively. When the market rises, many logics can hold. Only when real volatility occurs is it easier to see which assets can withstand verification and which positions need to be adjusted.
No one can accurately know when the next opportunity will arise, but investors can prepare their accounts in advance: understand the cash flow risks of companies with high capital expenditures, break down highly correlated thematic positions, and keep funds reasonably liquid. This way, when the market presents opportunities, the question is not just "do I dare to buy," but also the ability to further judge why to buy, how much to buy, and under what circumstances to exit. Long-term trading does not seek to catch every bottom; it seeks the ability to manage risks and retain choices in different market environments.
Disclaimer: The content of this article is for general information and market commentary purposes only, compiled based on publicly available information as of the time mentioned in the text. Relevant market data, expectations, and probabilities may change with market conditions. The views and investment strategies cited from third-party institutions, analysts, or other individuals represent the views of the relevant third parties at a specific time and do not represent the views or recommendations of BIT. This article does not constitute investment advice, investment research, solicitation, or recommendation of any securities, investment products, or trading strategies, nor should it be the basis for any investment decision. Financial markets carry risks, and securities prices and market performance may fluctuate; past performance and historical market trends do not represent or guarantee future results. Investors should independently assess relevant risks based on their own circumstances and seek professional advice when necessary.
 Risk warning Risk warning




Popular articles