OKLink: After the Era of Bitcoin Spot ETF, On-chain Data Reveals the True Supply and Demand Relationship

 At the beginning of March, the Federal Reserve (FED) released its semi-annual monetary policy report. As market expectations for a rate cut in June rose, gold prices reached their highest level of 2024. Just a day later, BTC also hit a new market capitalization high. The approval of the Bitcoin spot ETF can be seen as a watershed moment; after two months, the driving force of finance is accelerating the maturation of the crypto market, making it more complex.
Produced by | OKLink Research Institute
Author | Hedy Bi
The views in this article are solely based on the author's analysis of on-chain data and do not constitute a recommendation or opinion on any potential investment targets, nor should they be considered investment advice.
At the beginning of March, the Federal Reserve (FED) released its semi-annual monetary policy report. As market expectations for a rate cut in June rose, gold prices reached their highest level in 2024. Just a day later, BTC also hit a new market capitalization high. The approval of the Bitcoin spot ETF can be seen as a watershed moment; after two months, the financial push is accelerating the maturation of the crypto market, making it more complex.
However, as a "honest" indicator reflecting the true state of the market, on-chain data shows an increasingly polarized trend among investors. As mentioned in the previous article by OKLink Research Institute, "Countdown to Bitcoin Spot ETF Approval: The U.S. Won't Let Go Easily!" stating that "the new market is poised for takeoff, while the existing market is more resolute." This article analyzes the BTC market from the perspective of supply and demand and market distribution using on-chain data from OKLink, CryptoQuant, and Glassnode:
1. Analyzing BTC Supply and Demand from On-Chain Data
From the supply side, as of the time of writing, data from CryptoQuant shows that over 30 centralized exchanges currently have BTC holdings in a state of outflow, totaling approximately 71,934 BTC.
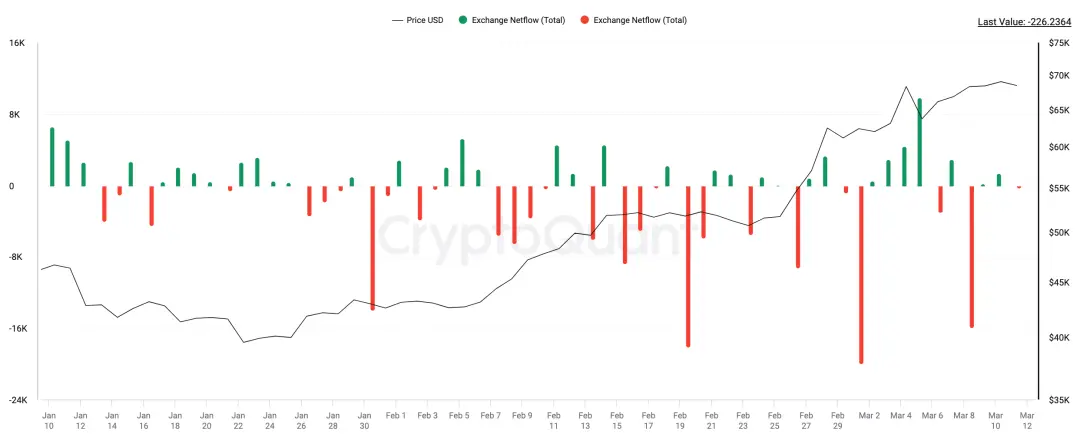 Figure: Net inflow/outflow of BTC on centralized exchanges from January 11, 2024, to present (March 10 complete data)
Data Source: CryptoQuant
Additionally, we can see that miners are continuously selling, mainly to liquidate before the next halving. The next mining halving will reduce the mining reward from 6.25 BTC to 3.125 BTC. As of the time of writing, wallets associated with cryptocurrency miners show a net outflow of approximately 8,530 BTC since the ETF approval. This means that the total BTC reduced from the two major supply sources, exchanges and miners, is about 80,464 BTC. Here, we have calculated using the net outflow number, as net outflow data includes the difference between miners' demand for holding coins and the actual mined BTC.
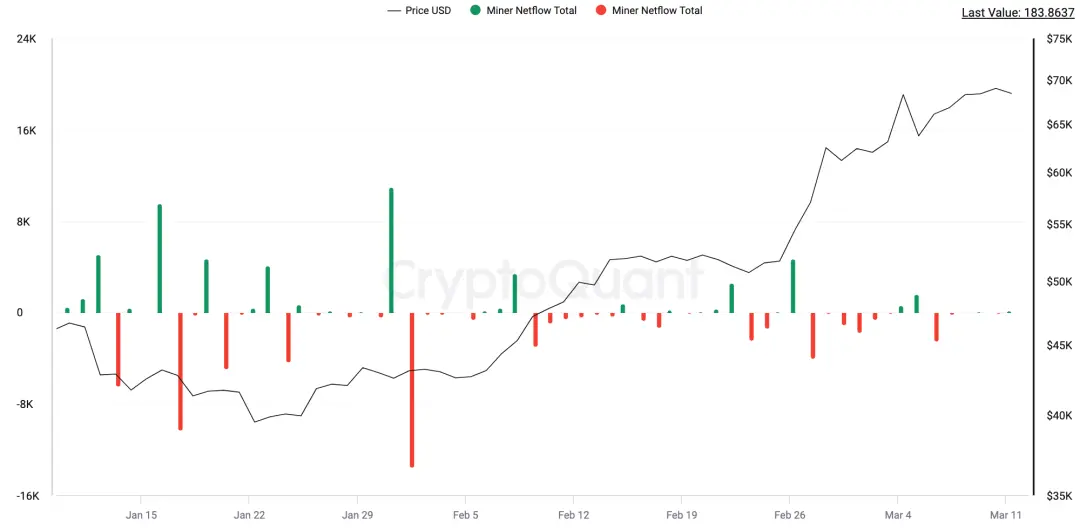
Figure: Net inflow/outflow of BTC in miner wallets from January 11, 2024, to present (units: BTC)
Data Source: CryptoQuant
On the demand side, despite ongoing discussions in the market about Grayscale continuously selling BTC, due to discrepancies in data sources and the timing of updates from various institutions regarding the spot ETF, a comprehensive calculation based on CryptoQuant and Farside data shows that the total capital entering the market through the BTC spot ETF has reached $9.594 billion. Compared to when the BTC spot ETF was allowed to trade, as of the local closing time on March 8, the net inflow was approximately 176,396 BTC. The BTC spot ETF alone has created a state of supply not meeting demand in the market, with a current gap of over 95,000 BTC. However, the true source of BTC supply is the miners. Although there are other channels like exchanges from which BTC flows out, these are not sustainable sources of supply.
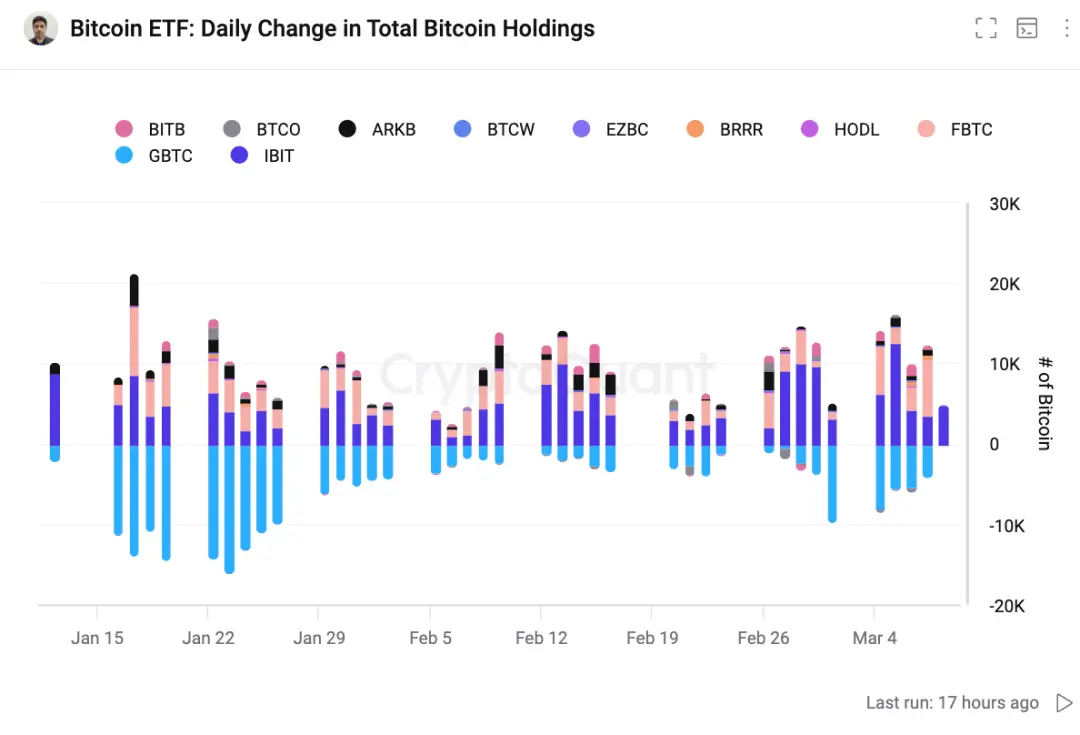 Figure: Net inflow/outflow of Bitcoin Spot ETF from January 11, 2024, to present (units: BTC)
Data Source: CryptoQuant
In about 40 days, the BTC halving will reduce the newly generated supply by half. According to BTC's design: the reward will be halved every 210,000 blocks until the block reward reaches zero in 2140, at which point all BTC will be issued, with a final total supply fixed at 21 million.
Moreover, unlike previous halvings, a groundbreaking innovation has emerged within the BTC ecosystem—inscriptions. According to on-chain data from Dune, the fees contributed to the BTC ecosystem from this innovation have reached 6,290 BTC, providing some revenue for miners. In the future, as the innovative applications of the BTC ecosystem develop and L2 solutions expand scalability, miners' income will also increase, alleviating the actual pressure on miners to sell BTC to cover mining costs. This means that the supply situation is different from previous halvings; the pressure to sell to the market is reduced, and miners are more willing to hold coins rather than supply them to the market.
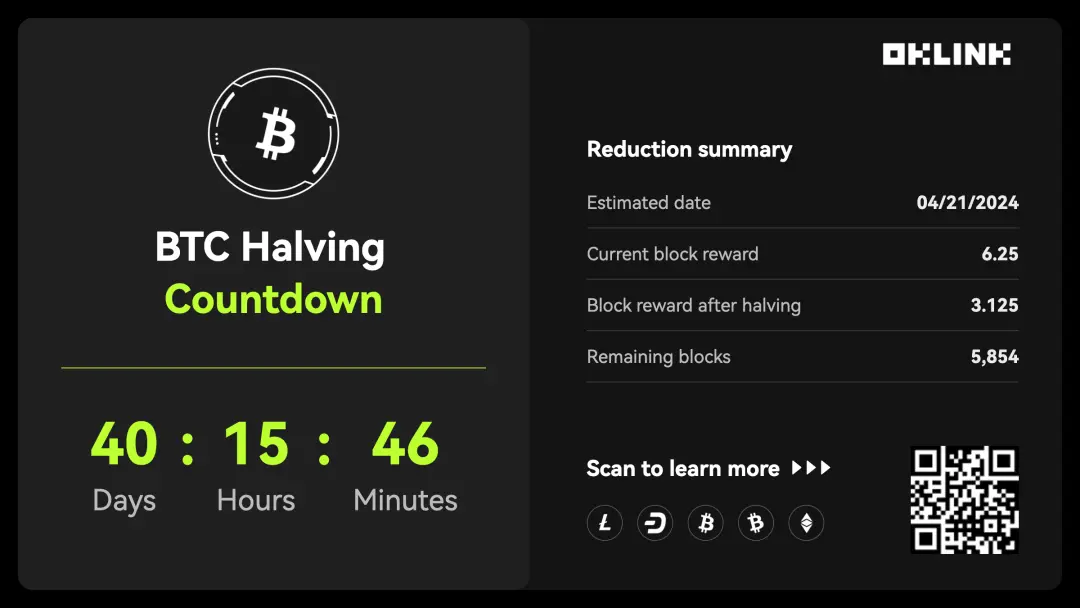
Figure: Overview of BTC halving at noon on March 11
Data Source: OKLink
2. BTC Market Distribution: Transitioning On-Chain
If we assume that most new investors are entering the market due to the BTC spot ETF, then non-zero addresses on-chain can be assumed to be primarily older investors. According to OKLink data, the number of non-zero addresses on-chain shows a clear upward trend, indicating that the number of addresses holding assets is increasing, not just due to increased address interactions, which also reflects signs of BTC transfer.
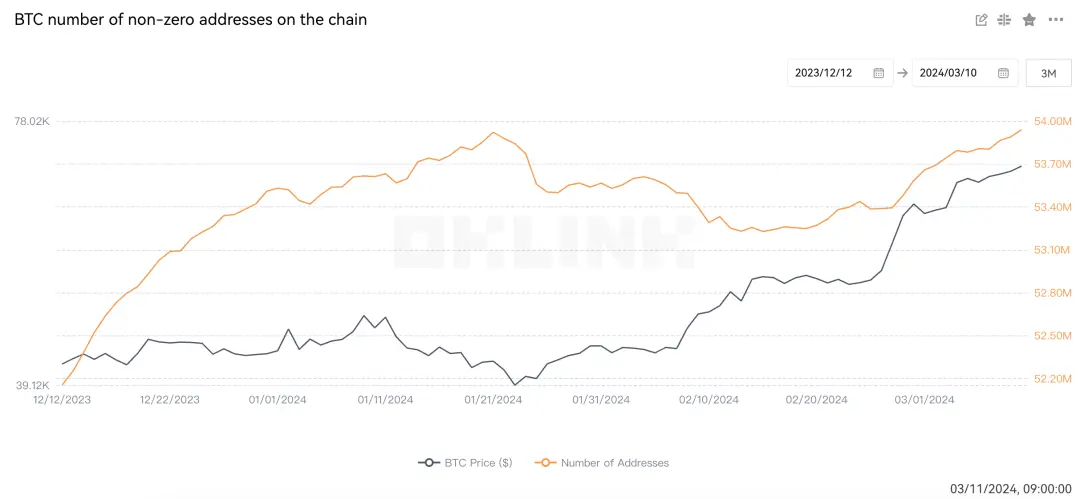
Figure: Number of non-zero asset wallet addresses for BTC over the past 3 months
Data Source: OKLink
More detailed and specific asset movement can also be viewed in real-time on blockchain explorers, including large transfers. From OKLink data, it can be seen that the frequency of large BTC transfers has also increased in recent days.
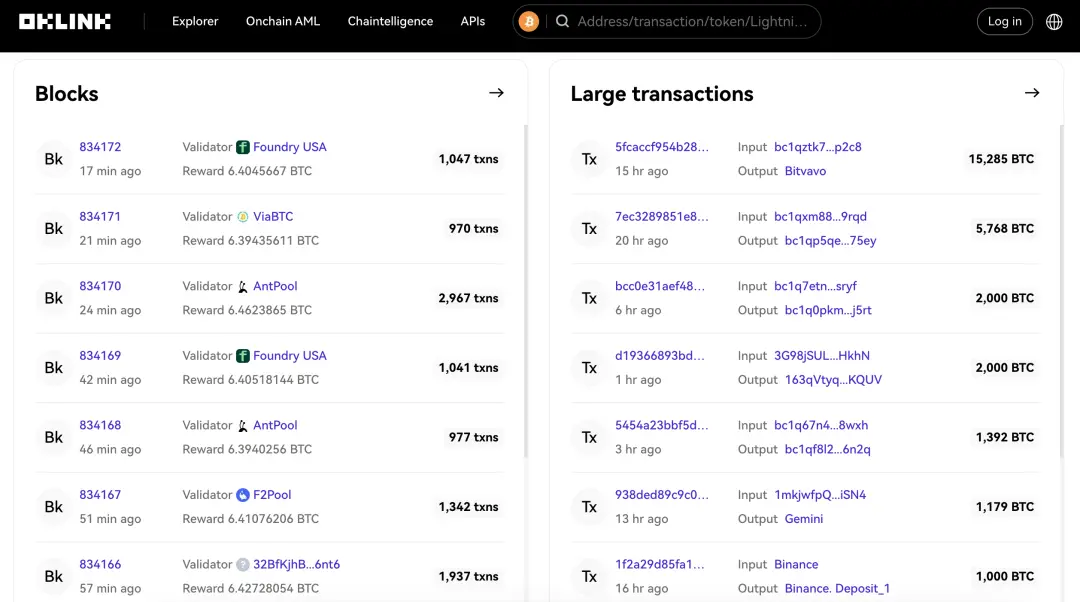
Figure: Large asset transfers on the BTC blockchain explorer
Data Source: OKLink
According to Glassnode statistics, the amount of BTC transferred to long-term storage is increasing at a rate of 180,000 BTC per quarter, which is twice the amount of newly mined BTC. This shift towards holding BTC as a long-term investment further tightens BTC supply and may strengthen BTC's price foundation as the halving approaches.
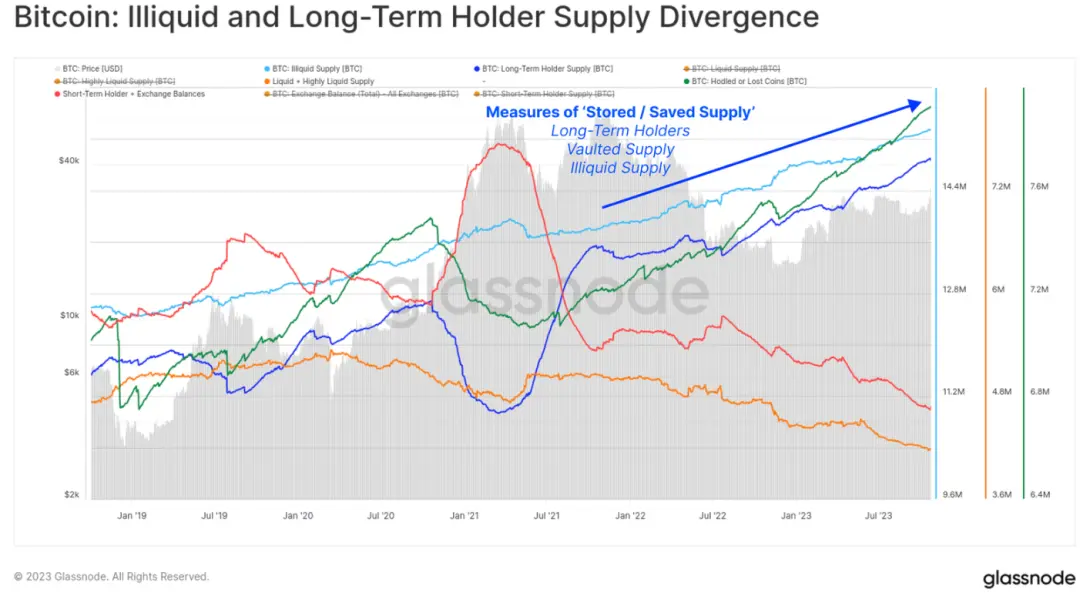
Figure: Supply divergence between illiquid and long-term holders
Data Source: Glassnode
Long-term holders transitioning on-chain show an expanding trend in both the number of addresses and the amount of funds. According to a recent report from Glassnode, the locking rate of BTC for long-term investment has exceeded 200% of the new supply. This means that although new BTC is still being mined, more BTC is being held by investors rather than sold or traded.
3. VS Gold ETF? Still Looking at Scarcity
In addition to on-chain data indicating that BTC is currently in a state of supply not meeting demand, BTC's scarcity also sustains this trend. Unlike fiat currency supply, which relies on central banks, and the supply of precious metals like gold, which is limited by natural resources, the issuance speed of BTC and its total supply of 21 million have been predetermined by its foundational protocol since its inception.
When discussing scarcity, one cannot overlook gold. Often used as a comparison to BTC, gold is considered a "scarce" asset due to its high mining costs and limited natural resources. Particularly in the face of inflation and conflict, its scarcity becomes even more pronounced, making it a classic example of fear-driven trading. Therefore, the historical performance of the gold market is often used to analyze the BTC market.
In terms of ETF performance, since the first gold spot ETF was approved in 2004, gold prices have continued to rise, with an increase of 346% in less than ten years. However, gold took a considerable amount of time to gain widespread recognition. In contrast, BTC took only 15 years from its inception to the approval of the spot ETF in 2024. Despite the ongoing market heating, we need to consider that gold has an important historical position in the financial sector. In 1717, the UK first adopted the gold standard, incorporating gold as a key component of the monetary system.
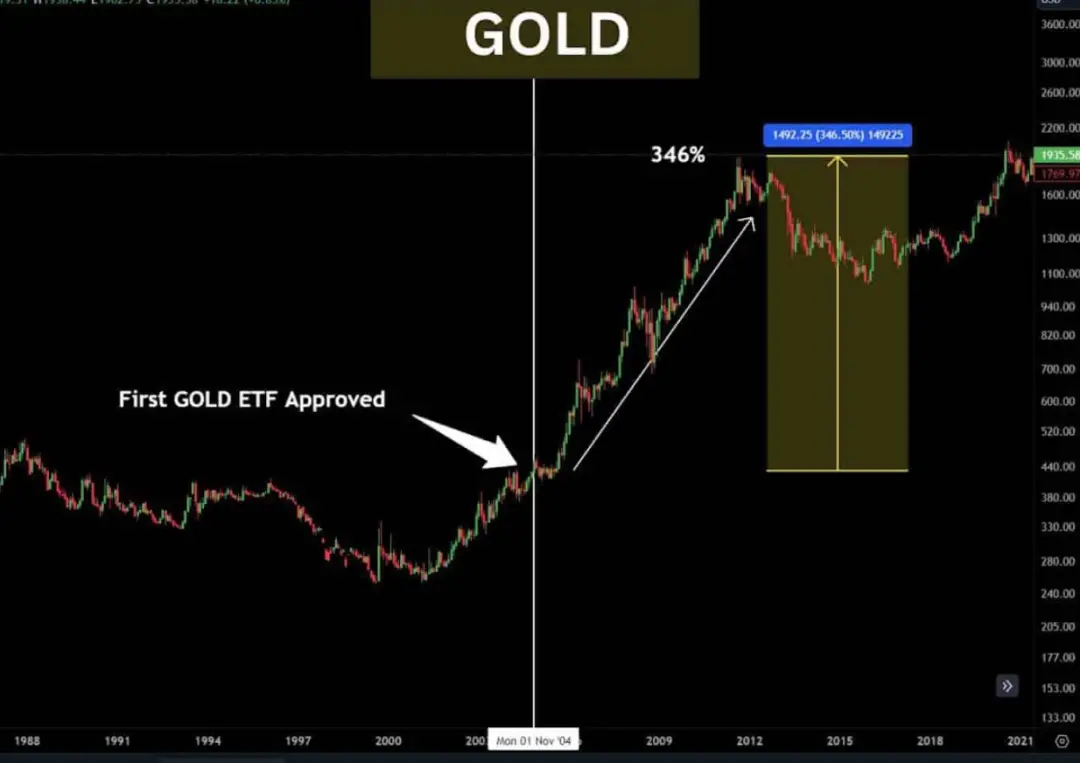
Figure: Comparison of gold before and after the spot ETF
Data Source: Ash Crypto
When exploring the uniqueness of BTC as "digital gold," its distinctiveness in the financial system is also worth noting, in addition to its material scarcity. The decentralized design of BTC allows it to be held outside the traditional financial system while providing billions of unbanked individuals with access to the global financial system.
As the BTC market develops, the decentralized nature of BTC diversifies participants and deepens connections with traditional financial markets. The complexity of the market is closely related to the acquisition of data. In this context, the analysis and acquisition of on-chain data are more accessible compared to data information from traditional financial markets. On-chain data comes from a global network of nodes and has the characteristics of a public ledger, allowing anyone to conduct real-time market analysis and statistics without relying on centralized institutions. This decentralized nature brings transparency and fairness to the data and effectively avoids the risks of single points of failure and tampering.
In the increasingly mature and complex crypto market, the analysis and acquisition of on-chain data are already more accessible than data information from other financial markets. The more complex the market, the more apparent the advantages of on-chain data. Due to its uniqueness, on-chain data will become our closest representation of the market's truth.
 Risk warning
 Risk warning