11 Charts Interpreting the May Cryptocurrency Market: Approval of Spot ETFs Helps Ethereum's Multiple Indicators Reach All-Time Highs
Summary:
In May, the majority of indicators in the cryptocurrency market experienced a decline. This article will use 11 charts to interpret the state of the crypto market over the past month.

2024-06-03 09:40:19
Collection
 In May, the majority of indicators in the cryptocurrency market experienced a decline. This article will use 11 charts to interpret the state of the crypto market over the past month.
Author: The Block Research Director Lars
Compiled by: Jordan, PANews
In May, the majority of indicators in the cryptocurrency market experienced a decline. This article will interpret the state of the crypto market over the past month with 11 charts.
- In May, the total on-chain transaction volume for Bitcoin and Ethereum fell by 4.4% after adjustments, dropping to $390 billion. The adjusted on-chain transaction volume for Bitcoin decreased by 4.7%, while Ethereum's on-chain transaction volume fell by 3.9%.

- The adjusted on-chain transaction volume for stablecoins in May decreased by 20.5%, falling to $879 billion. The supply of issued stablecoins increased slightly by 0.5%, rising to $141.9 billion, with the market share of the US dollar stablecoin USDT growing to 78.8%, while the market share of USDC slightly declined to 17.1%.

- Bitcoin miner revenue fell to $963 million in May, a decrease of 46%. Additionally, Ethereum staking revenue rose by 4.1%, increasing to $267 million.

- In May, the Ethereum network burned a total of 26,747 ETH, worth approximately $91.7 million. Data shows that since the implementation of EIP-1559 in early August 2021, Ethereum has burned a total of about 4.3 million ETH, valued at approximately $12.1 billion.

- The on-chain NFT market for Ethereum saw a significant decline in May, dropping by 27.8% to approximately $344 million.

- The spot trading volume on compliant centralized exchanges (CEX) fell by 22.5% in May, dropping to $68.9 billion.

- The ranking of spot market shares among major cryptocurrency exchanges in May was as follows: Binance at 79.4% (an increase from April), Coinbase at 10.1%, Kraken at 3.4%, and LMAX Digital at 1.8%.

- In the crypto futures market, the open interest for Bitcoin futures increased by 12.9% in May. Meanwhile, thanks to the approval of a spot Ethereum ETF by U.S. regulators, the open interest for Ethereum futures surged by 52%, reaching an all-time high. In terms of trading volume, Bitcoin futures trading volume decreased by 21% to $1.26 trillion, while Ethereum futures trading volume increased by 0.2%.

- In May, the open interest for Bitcoin futures on the Chicago Mercantile Exchange increased by 15.9%, rising to $10.3 billion, while the daily average volume decreased by 9%, dropping to approximately $4.35 billion.

- The average monthly trading volume for Ethereum futures decreased to $69.2 billion, a slight increase of 0.2%.

- In the cryptocurrency options market, the open interest for Bitcoin options rebounded by 30.5%, while Ethereum's open interest also increased by 41.4%. Additionally, in terms of trading volume, Bitcoin options trading volume reached $46.8 billion, a decrease of 1.2%; Ethereum options trading volume hit a new high of $31.4 billion, an increase of 19.2%, setting a historical record.

 Risk warning
Related tags
Risk warning
Related reading
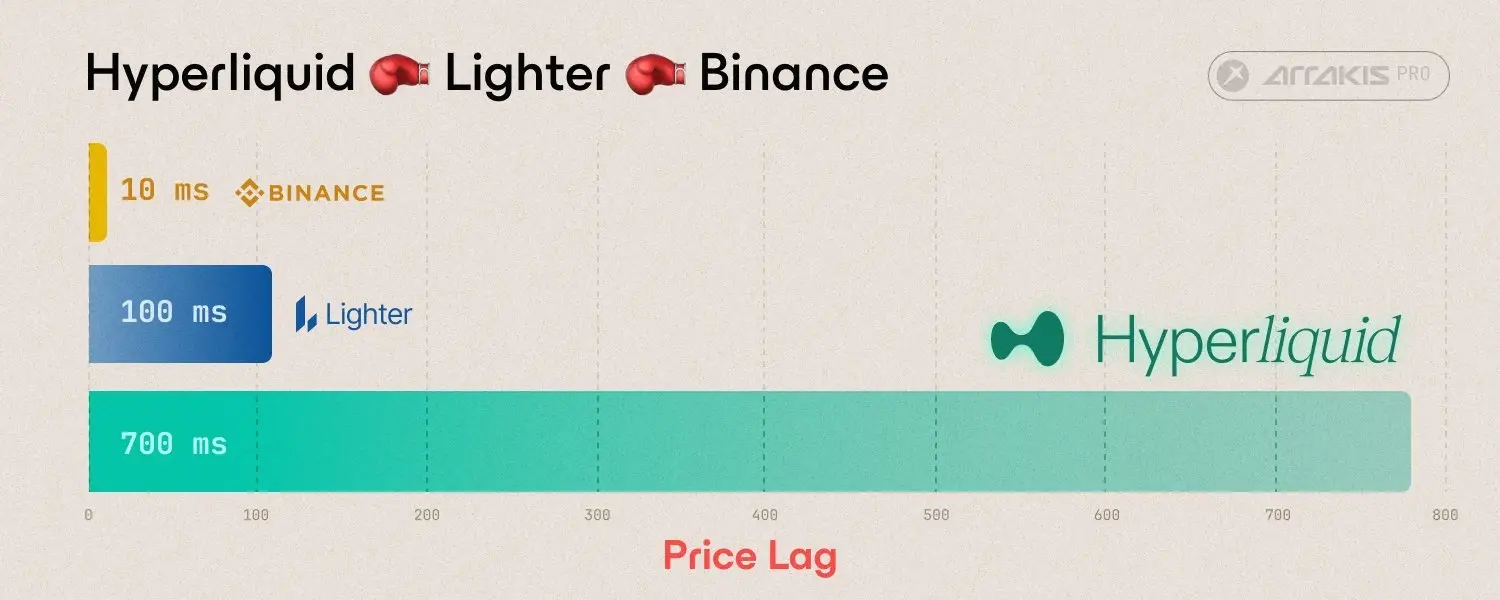
Who is leading the price discovery in the cryptocurrency market? Measured delays on platforms like Binance and Hyperliquid
2026-06-05

Daily Observation of Cryptocurrency Concept Stocks: BTC Drops to $61,300 - Charles Schwab Analyst's "Momentum Loss" Theory is More Worrisome than Saylor's AI Rotation Argument
2026-06-05

Bitget UEX Daily Report | U.S. House limits Trump's military action against Iran; Bitcoin deeply corrects to $63,000; AI chip supply crisis highlighted (June 4, 2026)
2026-06-04