BTC Volatility Weekly Review (September 15 - 22)
Summary:
The BTC spot price is trending sideways as expected. Currently, our basic assumption is that the price will test the low of $112,000 again (possibly briefly dipping to $111,000–$110,000). If it can find support and rebound at this level, the market may attempt to break through the historical high again. This final wave of increase will then set the stage for a sharp price decline. If the key support level of $110,000–$112,000 is lost, it may indicate the end of a multi-year upward trend.

2025-09-24 19:53:59
Collection
 The BTC spot price is trending sideways as expected. Currently, our basic assumption is that the price will test the low of $112,000 again (possibly briefly dipping to $111,000–$110,000). If it can find support and rebound at this level, the market may attempt to break through the historical high again. This final wave of increase will then set the stage for a sharp price decline. If the key support level of $110,000–$112,000 is lost, it may indicate the end of a multi-year upward trend.
Key Indicators: (Hong Kong Time September 15, 4 PM -> September 22, 4 PM)
- BTC/USD: -2.2% ($115,500 -> $113,000)
- ETH/USD: -9.1% ($4,600 -> $4,180)
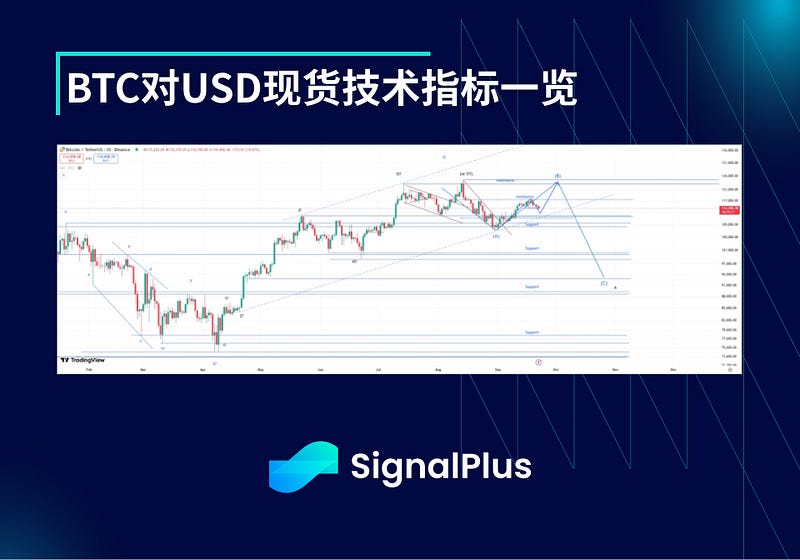
- The BTC spot price is consolidating as expected. Currently, our basic assumption is that the price will test the $112,000 low again (possibly briefly dipping to $111,000 - $110,000). If it can find support and rebound at this level, the market may attempt to break through the historical high again. This last wave of increase will then set the stage for a sharp price decline. If the key support level of $110,000 - $112,000 is lost, it may indicate that the multi-year uptrend actually completed when it reached $124,000 - $125,000 in August. On a local level, the upper resistance is at $116,000, with larger resistance at $117,500 - $118,000. It is worth noting that this resistance level successfully suppressed price increases after both the Jackson Hole meeting and the FOMC meeting.
Market Theme:
- This week, the market focus is on the FOMC meeting. After the release of U.S. data this month, a 25 basis point rate cut has become a certainty, but all eyes are on Powell's tone and the committee's "dot plot" to confirm whether the market's pricing of future interest rate paths is accurate enough. This turned out to be the case, as the dot plot indicated an additional 50 basis points cut this year, and Powell and the committee currently hold a relatively optimistic view on the inflation risks brought by tariffs. The stock market reacted with a knee-jerk rise, while the dollar was sold off, but since the market had largely priced this in and began to take profits, this trend quickly reversed. However, the stock market continued to rise, as there were no other clear resistances, and the steadily improving U.S.-China relations provided additional tailwinds.
- Initially, cryptocurrencies benefited from the risk-friendly FOMC stance, with BTC testing the key resistance level of $117,500 - $118,000 within 24 hours after the meeting. The ETF inflows, which had surged in the previous two weeks, performed flat. However, the market felt disappointed again due to a lack of follow-up buying and the relatively poor performance of cryptocurrencies, leading BTC to ultimately give back all gains and drop to the $112,000 support level on Monday; SOL fell back to $220 after failing to break through $250; ETH also faced resistance around the key level of $4,800 and plummeted to $4,150 on Monday. Overall, it seems there are other attractive investment avenues (mainly in the U.S. tech/AI sector) in the current market environment, so retail participation in cryptocurrencies remains low.
BTC Volatility
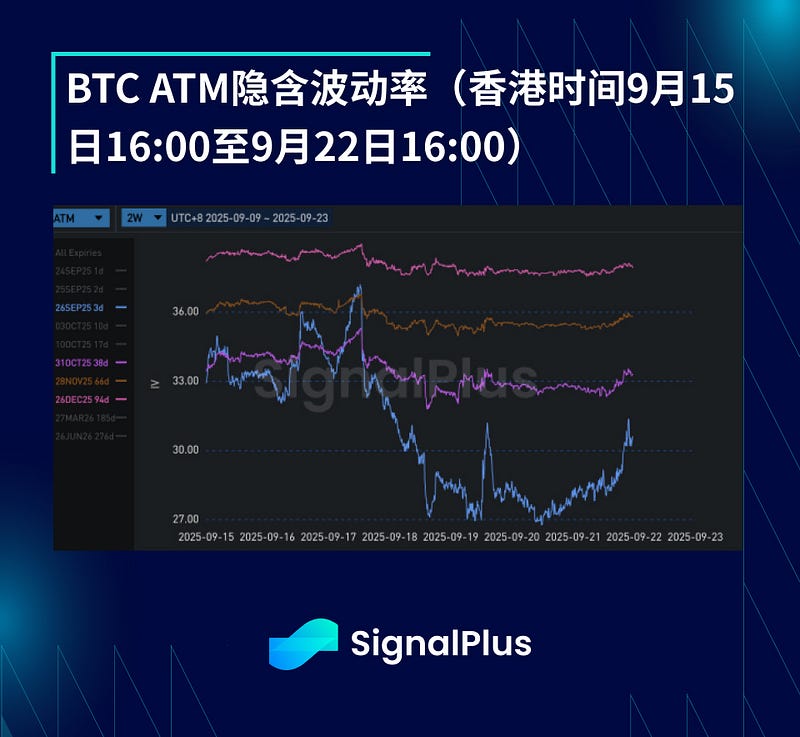
- Last week, actual volatility continued to hover in the low 20% range. ETF inflows and treasury asset purchases (such as MSTR) provided support for the coin price, but there was still significant selling pressure during each rise, temporarily limiting the actual volatility in the upward direction. Poor local Gamma performance led to daily volatility pricing around 22-25 volatility points this week; ahead of the FOMC meeting, there was a spike that pushed overnight volatility up to 60 points, pricing in a 2.4% volatility expectation, but this level of volatility ultimately did not materialize.
- The lackluster actual volatility placed heavy pressure on the implied volatility curve, especially on the short-term implied volatility up to last Friday. Over the weekend, there was new selling pressure on short options at local lows of 25-26 points, as the market continued to seek guaranteed returns in this environment. At the long end of the term curve, volatility levels have relatively stable support, as the current levels have reached historical lows (based on a review of multi-year data).
BTC Skew/Kurtosis

- With a lack of follow-through momentum in the upward direction and low volatility, the market's tension pushed the skew significantly downward as the coin price began to retract over the weekend. Ultimately, there was indeed a significant pullback in the coin price on Monday. However, despite a 5.5% pullback from the peak, the actual volatility remained quite low, and the market clearly still held a considerable amount of Gamma long positions, so from the perspective of spot-volatility correlation, the current skew level's support is not stable.
- The kurtosis further increased over the weekend from already high levels, as the market continued to seek wing-side protection (especially downside protection) due to the weak price action and the need for institutions to hedge accumulated long positions over the past few months. However, this kurtosis (especially in the short term) is unsustainable, particularly considering that the underlying volatility is already very low — unless a breakout occurs quickly within a few days, any short-term wing-side protection will rapidly decay at the current levels.
Wishing you a successful trading week ahead!

 Risk warning Risk warning