BTC Volatility Weekly Review (November 10 - 17)
Summary:
The rebound brought by the news of the U.S. government reopening was short-lived. The market turned to test the support area of $98,000-$100,000 but then fell below it. This led to a drop to the support level of $93,000-$94,000, which has successfully absorbed selling pressure and held firm. Currently, it seems that the decline that started from $112,500-$115,000 after the flash crash in October has basically come to an end...

2025-11-19 19:47:33
Collection
 The rebound brought by the news of the U.S. government reopening was short-lived. The market turned to test the support area of $98,000-$100,000 but then fell below it. This led to a drop to the support level of $93,000-$94,000, which has successfully absorbed selling pressure and held firm. Currently, it seems that the decline that started from $112,500-$115,000 after the flash crash in October has basically come to an end...
Key Metrics (November 10, 4 PM HKT -> November 17, 4 PM HKT)
- BTC to USD: -10.0% ($106,200 -> $95,600)
- ETH to USD: -11.6% ($3,620 -> $3,200)
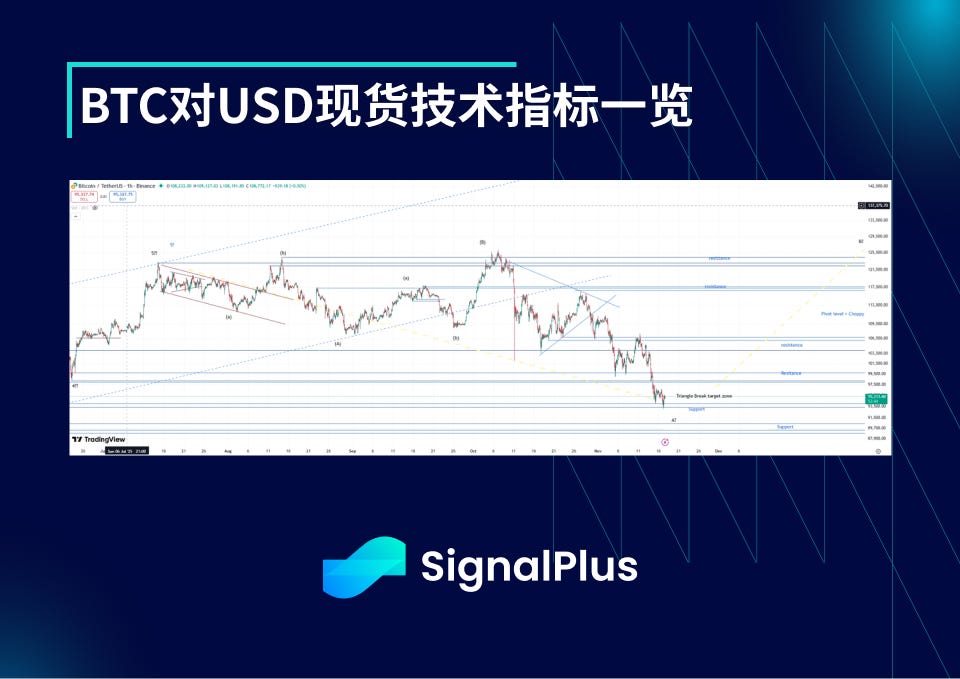
- The rebound triggered by the U.S. government restart news was short-lived. The market attempted to test the support area of $98,000-$100,000 but subsequently fell below it. This led to a drop to the support level of $93,000-$94,000, which has successfully absorbed selling pressure and held. Currently, the decline that started from $112,500-$115,000 after the flash crash in October seems to have largely ended, although it is difficult to determine the exact low point. We believe that small declines below this level provide good buying opportunities. More broadly, the ABC adjustment wave from $123,000 → $107,000 → $126,000 → currently to $93,000 seems to be nearing completion. However, given the intensified bearish sentiment, the market may attempt to break below $93,000-$94,000 again, potentially reaching $90,000.
- Market positions appear to have lightened, with CTA strategies currently estimated to hold short positions. Therefore, we believe the risk of further declines in the spot market is changing. If it breaks below $93,000, strong support is expected at $89,000-$90,500. If this support is also lost, there will be no strong support until $79,000 (with limited support at $83,000-$85,000), as the <$90,000 area was a highly volatile "pivot" point in March and April of this year. On the upside, initial resistance is at $98,000-$101,000, followed by $104,000-$107,000. We believe that regardless of the spot market's rise or fall, actual volatility may remain high, although the market may attempt to sell volatility due to easing pressure in the spot market (especially if we return above $107,000).
Market Themes
- Risk aversion sentiment is spreading, particularly evident in the U.S. tech/AI sector. The end of the government shutdown proved to be "buy the rumor, sell the fact," as the rebound in risk assets at the beginning of last week quickly faded. Concerns about AI valuations and spending/investment have resurfaced, while Federal Reserve officials' comments have generally leaned hawkish, leading the market to continuously adjust the pricing for a rate cut in December from over 90% probability a month ago to a current 50-50 chance. Interestingly, compared to October, the rise in the VIX index has been relatively mild, as U.S. stock indices have performed decently overall, with declines mainly concentrated in AI-related stocks.
- Cryptocurrencies were not spared from the sell-off in risk assets, with BTC plummeting back below $100,000 and breaking through the critical support at $98,000, hitting a low of $92,900 over the weekend before finding temporary balance near $95,000. ETH also tested $3,000 again but found better support above that level, rising back to around $3,200, which seems to be a more stable balance point over the past few trading days. Overall, after this sell-off, the risk-reward of buying crypto assets at the current level appears relatively attractive. We expect that if macro risk assets do not experience a more prolonged sell-off (or if the VIX does not spike significantly), market liquidity on both sides will increase. However, the native sentiment in cryptocurrencies is clearly weak, so the determination of IBIT holders/buyers will be tested in the coming trading days.
BTC/USD Volatility
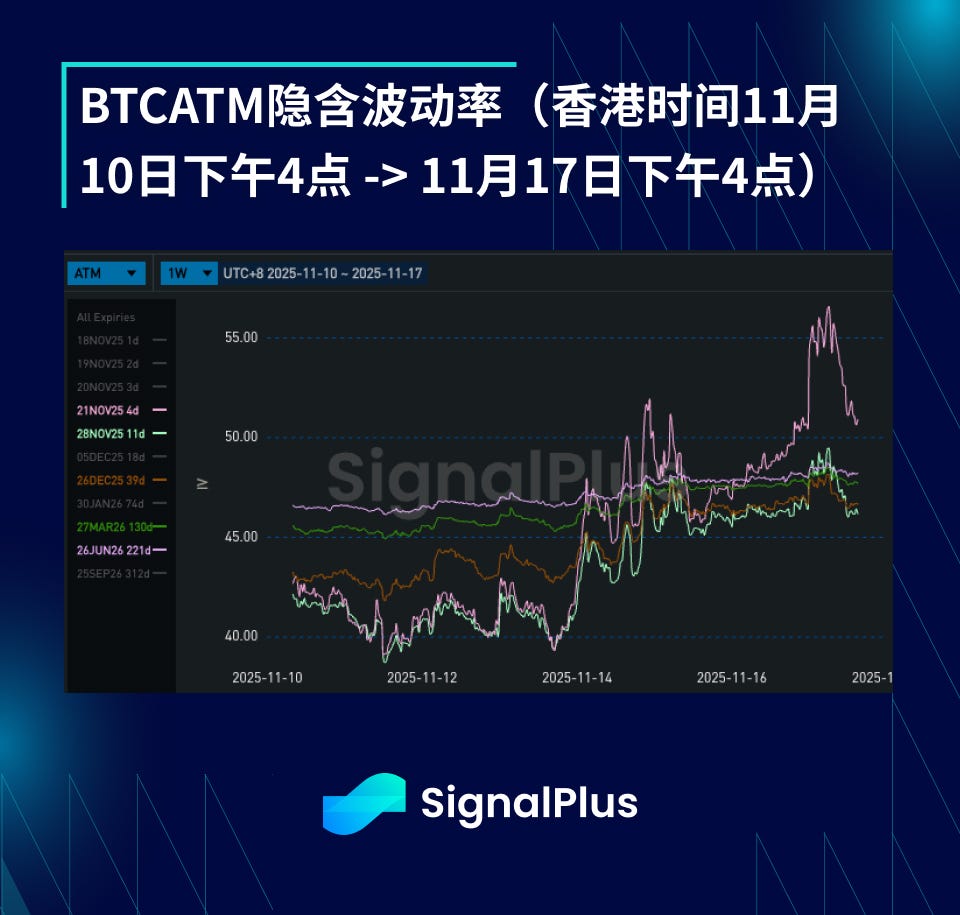
- As prices fell back below $100,000 and broke through the critical support at $98,000, implied volatility rose as expected, consistent with the recent correlation of "spot declines driving volatility increases." Actual volatility has remained high both on an hourly and daily basis, with over 90 volatility points observed from Thursday to Friday on a daily frequency. This prolonged period of high actual volatility has put considerable pressure on the market and naturally pushed up forward volatility, as the market has priced in a higher structural volatility premium following the unusually low actual volatility during the summer.
- The term structure of implied volatility has flattened due to rising front-end volatility, as Gamma performance remains high. The curve's movements are time-weighted (even though back-end volatility has also been repriced higher, Beta is lower relative to the front end), as the market still generally feels short. Over the past week, considerable demand has been observed for January/March/June straddles, as the market seeks to close some legacy short volatility positions established when the term structure was steep.
BTC/USD Skew/Kurtosis
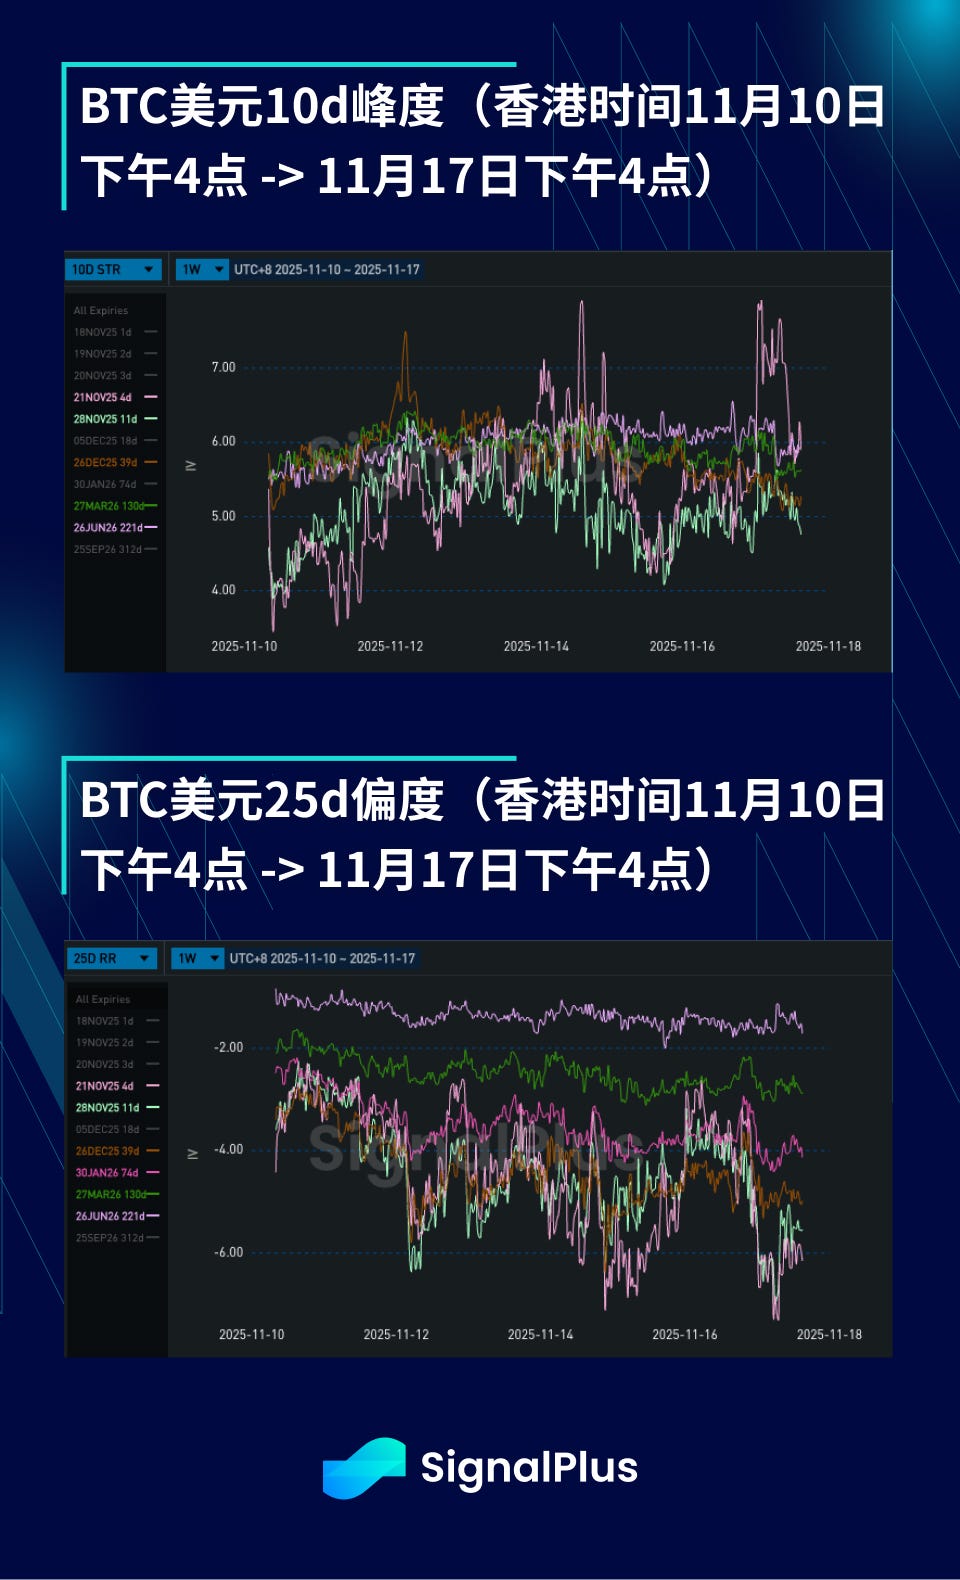
- As the $100,000 level was breached, the skew pricing of put options generally deepened, and there remains significant buying interest in put options on the Gamma term, as the downside in coin prices is currently still the weaker side. However, the market also recognizes that there is more two-way risk at the current level, especially in slightly longer terms, which keeps the skew pricing for longer terms relatively stable, as we have begun to see demand for options above the current lower prices for year-end and beyond.
- Kurtosis pricing has declined, as local Gamma performance has been good over the past few trading days, while the market has begun to discount extreme wings, as linear market positions seem cleaner, and many feel we are nearing the final stages of the sell-off. Directional demand for further downside appears in the form of put option spreads (e.g., year-end $90,000/$70,000 put spread), while upside strategies also seem to appear in the form of call spreads (e.g., $110,000/$125,000 call spread) — this again puts more kurtosis selling pressure on the market. Overall, at current levels, considering the high volatility we have witnessed, we believe the current kurtosis is approaching buy levels.
Wishing you a successful trading week ahead!

 Risk warning Risk warning