2026 Crypto TradFi Landscape Report: How Is Competition Evolving Amid Explosive Growth? | RootData Research
 Core Viewpoint

 Trading volume surpassed $1.3 trillion in the first half of 2026, with derivatives accounting for 98.6%.
Author: RootData
Introduction
In 2026, TradFi assets are becoming a new battleground for crypto exchanges.
As precious metals such as gold and silver, as well as global stock markets including U.S. and South Korean equities, have become increasingly active, more crypto exchanges are moving TradFi products from peripheral businesses into their core product lines. Assets that were once available only through traditional brokerages and financial markets are now entering crypto trading platforms in forms such as tokenized assets and perpetual contracts.
Crypto exchanges are also using this opportunity to open up new avenues for growth and break free from the crypto market’s long-standing cyclical constraints. This has made TradFi a new competitive variable among major exchanges.
Against this backdrop, RootData examines the current development of TradFi in the crypto market and the evolving competitive landscape among major exchanges from multiple dimensions, including market size, trading structure, exchange competition, and the key submarket of equity derivatives (contracts).
This report is based on data from the TradFi segments of major exchanges including Binance, Hyperliquid, OKX, Gate, and Bybit. It primarily covers derivatives and spot trading related to tokenized assets and does not include actual stock trading through traditional brokers. Because liquidity and users in TradFi trading are currently still highly concentrated on major crypto trading platforms that have already launched such products, comparing these core platforms provides a representative view of the current size, structure, and competitive landscape of the crypto TradFi market.
I. Overview of the Crypto TradFi Sector
1. H1 2026 Trading Volume Exceeds $1.3 Trillion, Entering a Phase of Explosive Growth
In the first half of 2026, the crypto TradFi sector moved from “testing the waters at the margins” into a phase of “explosive volume growth.”
Data from the sample of major mainstream exchanges shows that trading volume surpassed $1.3 trillion in the first half of 2026. By comparison, total TradFi trading volume for all of 2025 was only in the hundreds of billions of dollars. In just the first half of 2026, trading volume was already 10 times the level recorded for the whole of last year.
Behind this growth was the convergence of crypto exchanges’ early expansion into TradFi and market conditions in traditional finance.
Since 2025, mainstream platforms represented by Binance, OKX, and Gate have continued to expand their TradFi product lines, putting the necessary infrastructure in place ahead of time. As precious metals and global stock markets, including U.S. and South Korean equities, performed strongly this year, exchanges that had entered crypto TradFi early captured significant spillover demand and the benefits of strong traditional financial markets by actively listing popular TradFi assets and continuously iterating on product functionality.
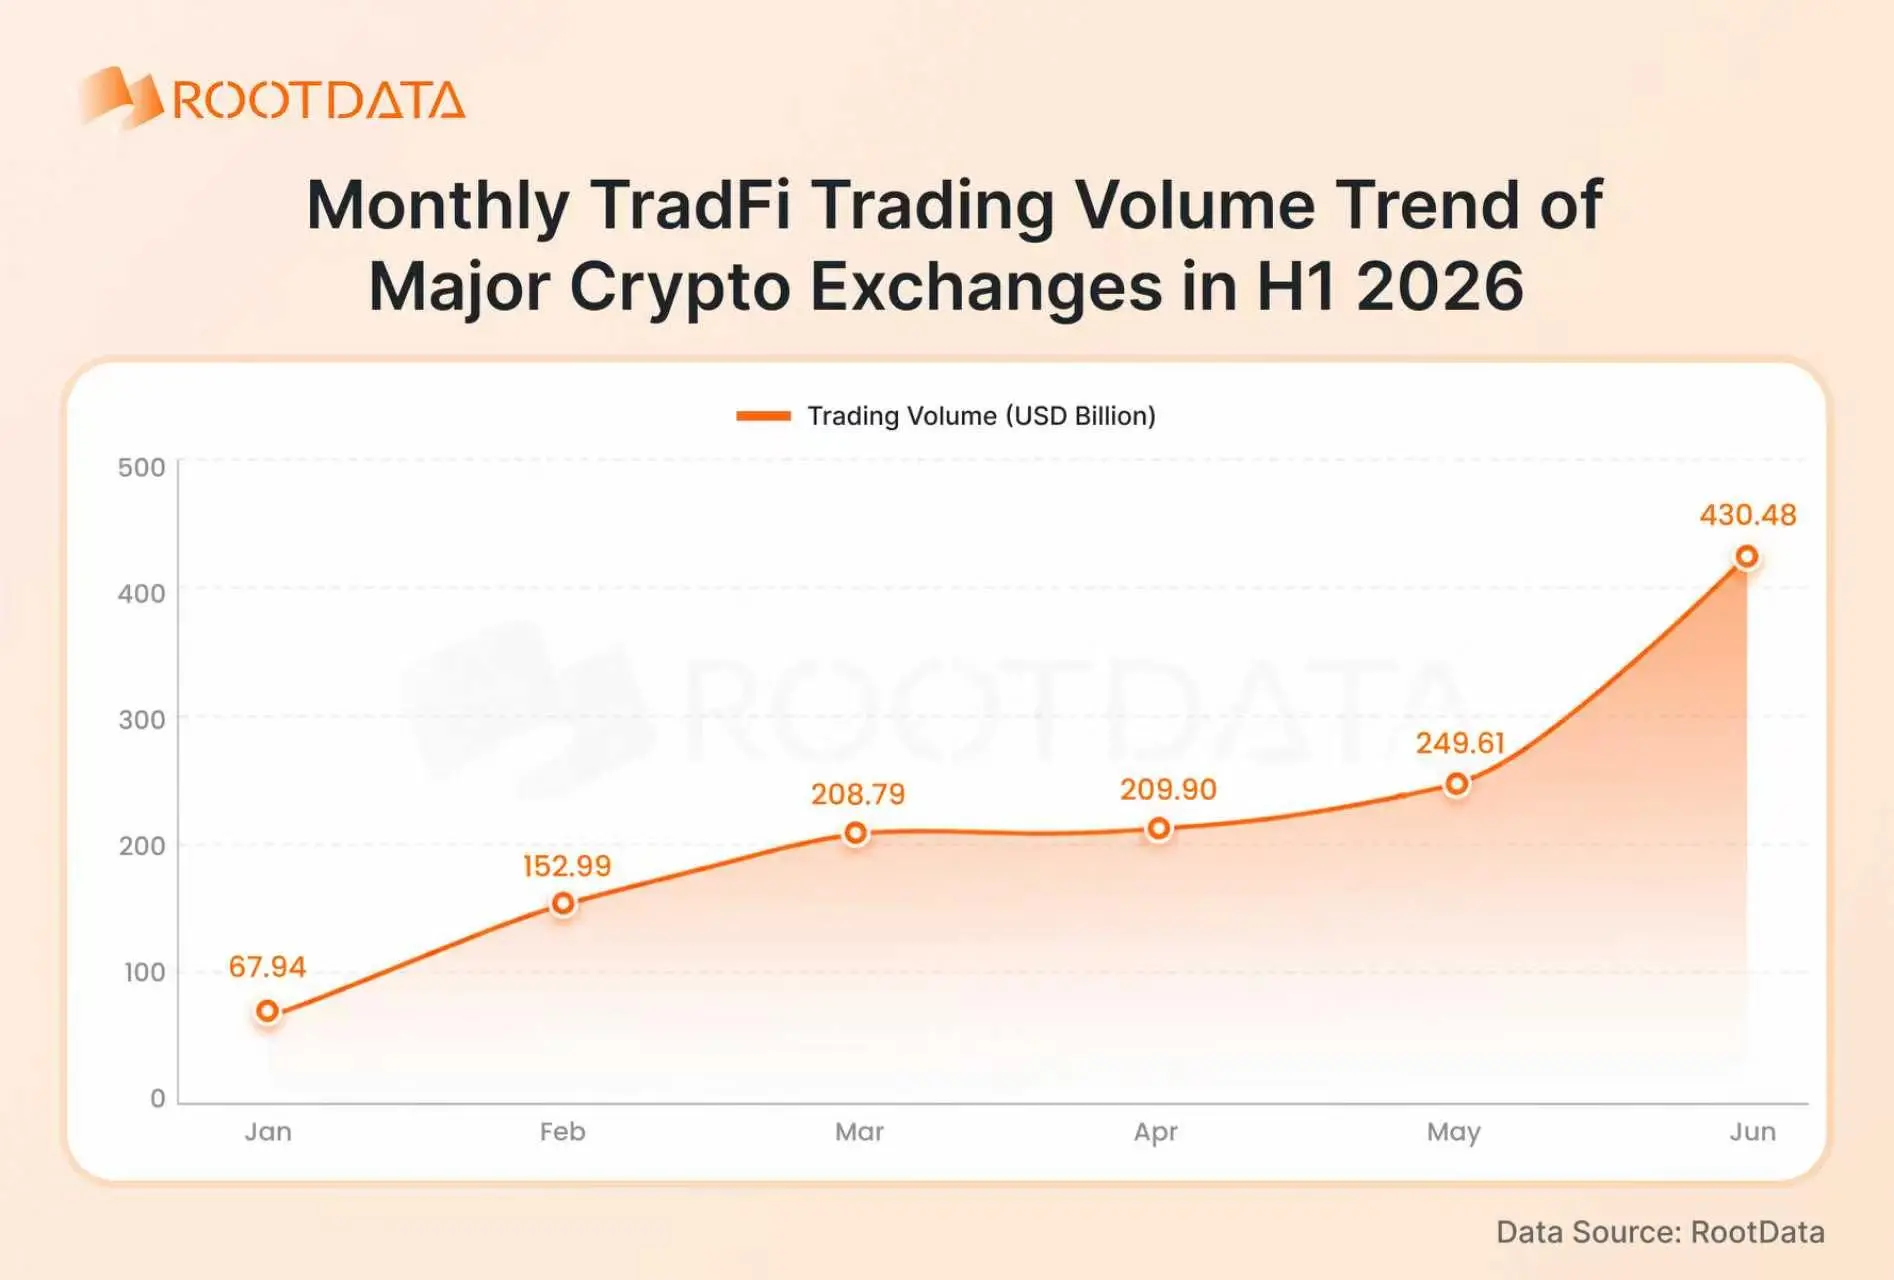
On a monthly basis, trading volume reached $67.94 billion in January, when market attention remained focused on precious-metal tokens such as gold. Spot trading accounted for 7.48%, reflecting the brief popularity of precious-metals RWAs at the beginning of the year.
Starting in February, monthly TradFi trading volume surged 125.2% month-over-month to $152.99 billion, breaking above the $100 billion mark. In June, driven again by market conditions, volume rose another 72.5% month-over-month to $430.48 billion, setting a new high for the first half of the year.
June’s monthly trading volume was already 6.3 times its January level, while the prevailing level of monthly trading volume shifted from below $70 billion at the start of the year to more than $400 billion. Should second-half activity hold at first-half levels, full-year TradFi trading volume could approach the $3 trillion mark.
2. Derivatives Dominate the TradFi Sector
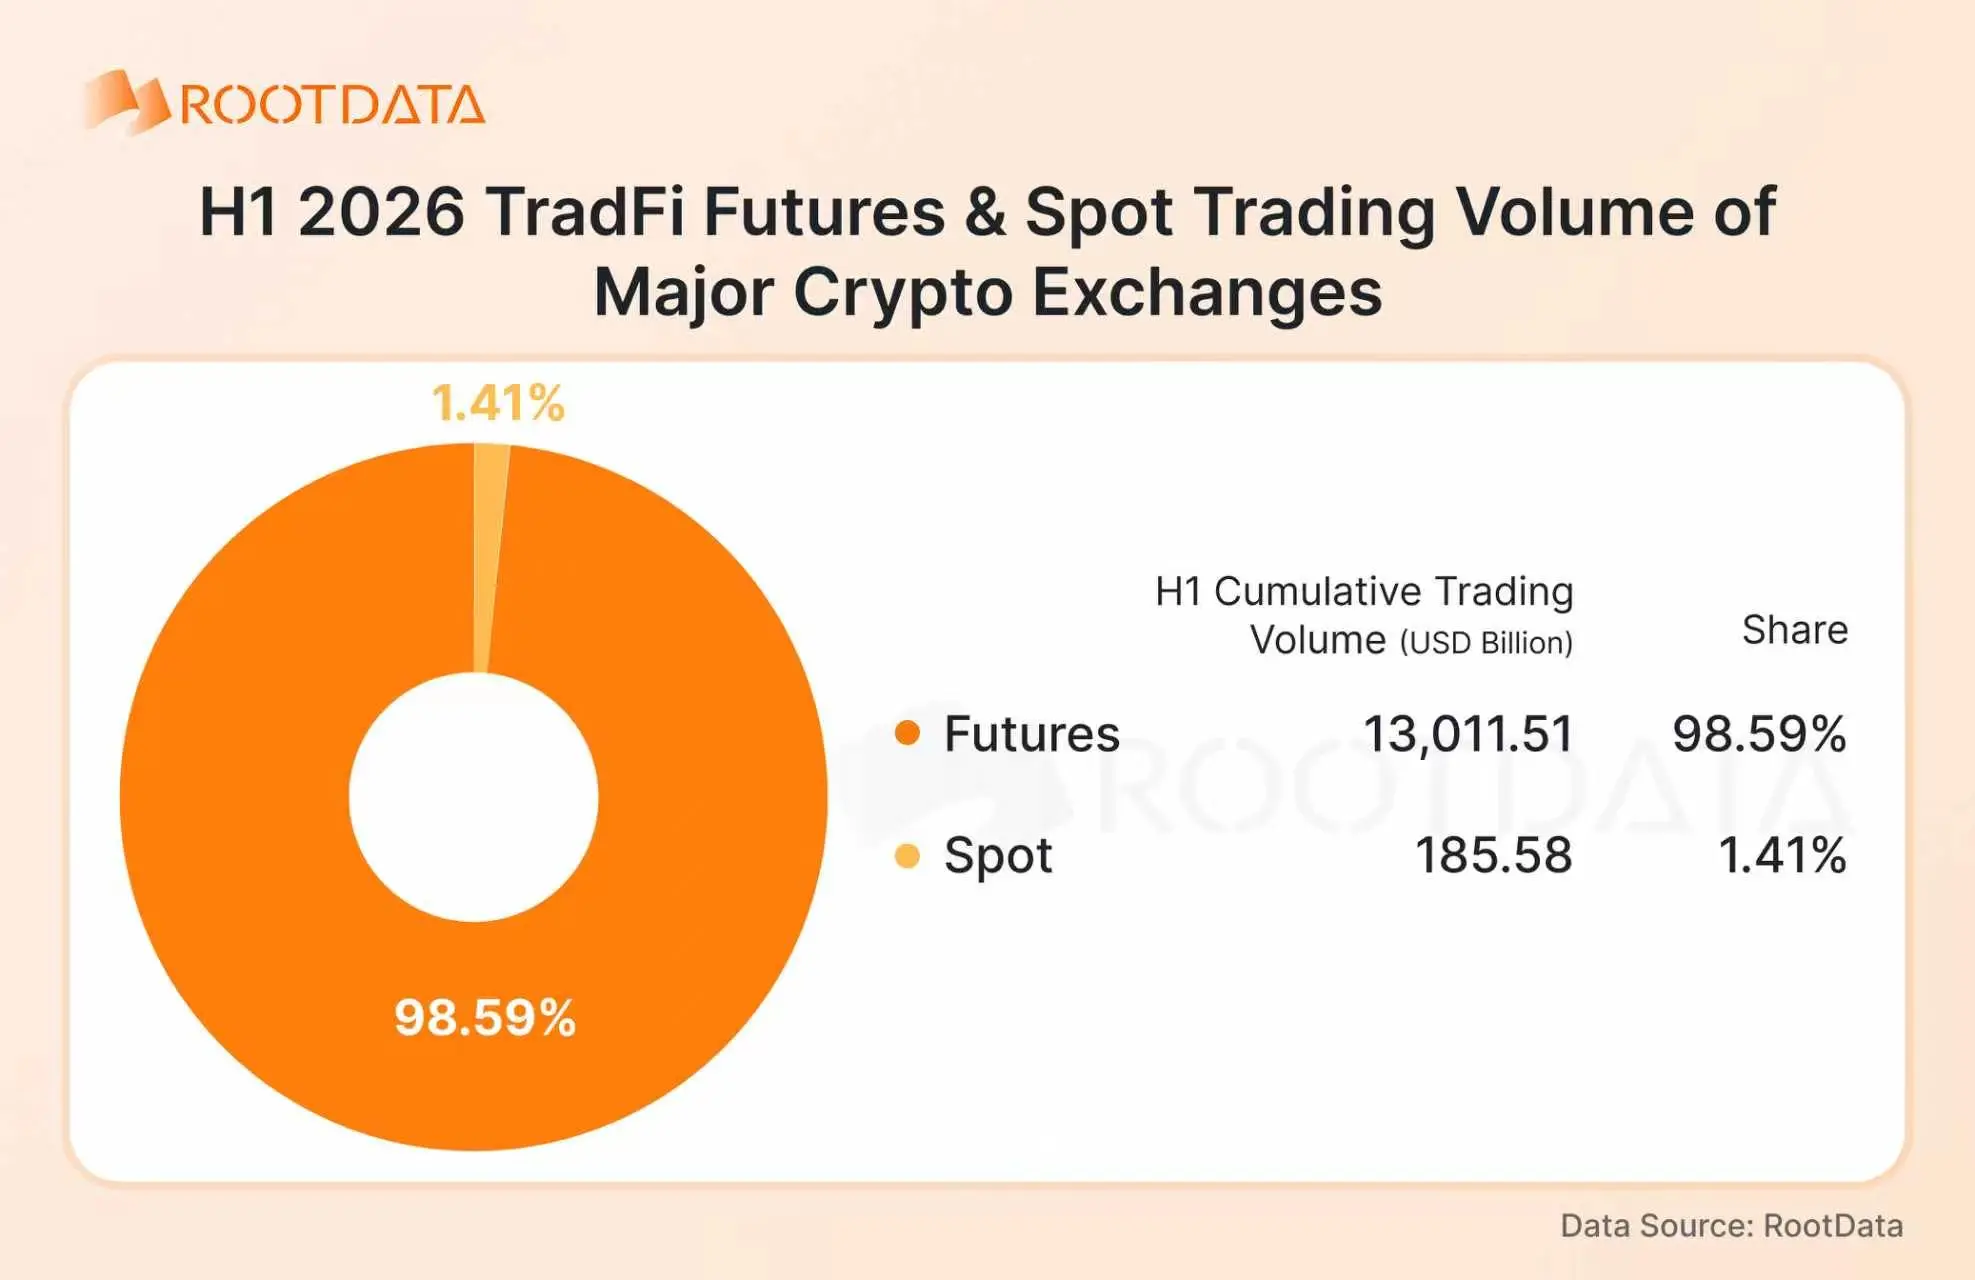
Equity derivatives account for the dominant share. In terms of asset coverage, more than 90% of the TradFi contract underlyings listed by the five exchanges are stocks and equity ETFs.
Open-interest data from the first half of 2026 also shows substantial growth in positions for popular TradFi assets including SNDK, SPCX, SK Hynix, and XAU. Open interest in XAU gold contracts at one point exceeded $700 million, while SPCX open interest peaked above $500 million.
II. Current Competitive Landscape of Crypto Exchanges in TradFi
1. Trading-Volume Share: From Binance Dominance to Multi-Tier Competition
The concentration of trading activity in the TradFi sector is undergoing a structural change.From January through August 24, 2026, the five exchanges recorded approximately $1.90 trillion in total TradFi trading volume.
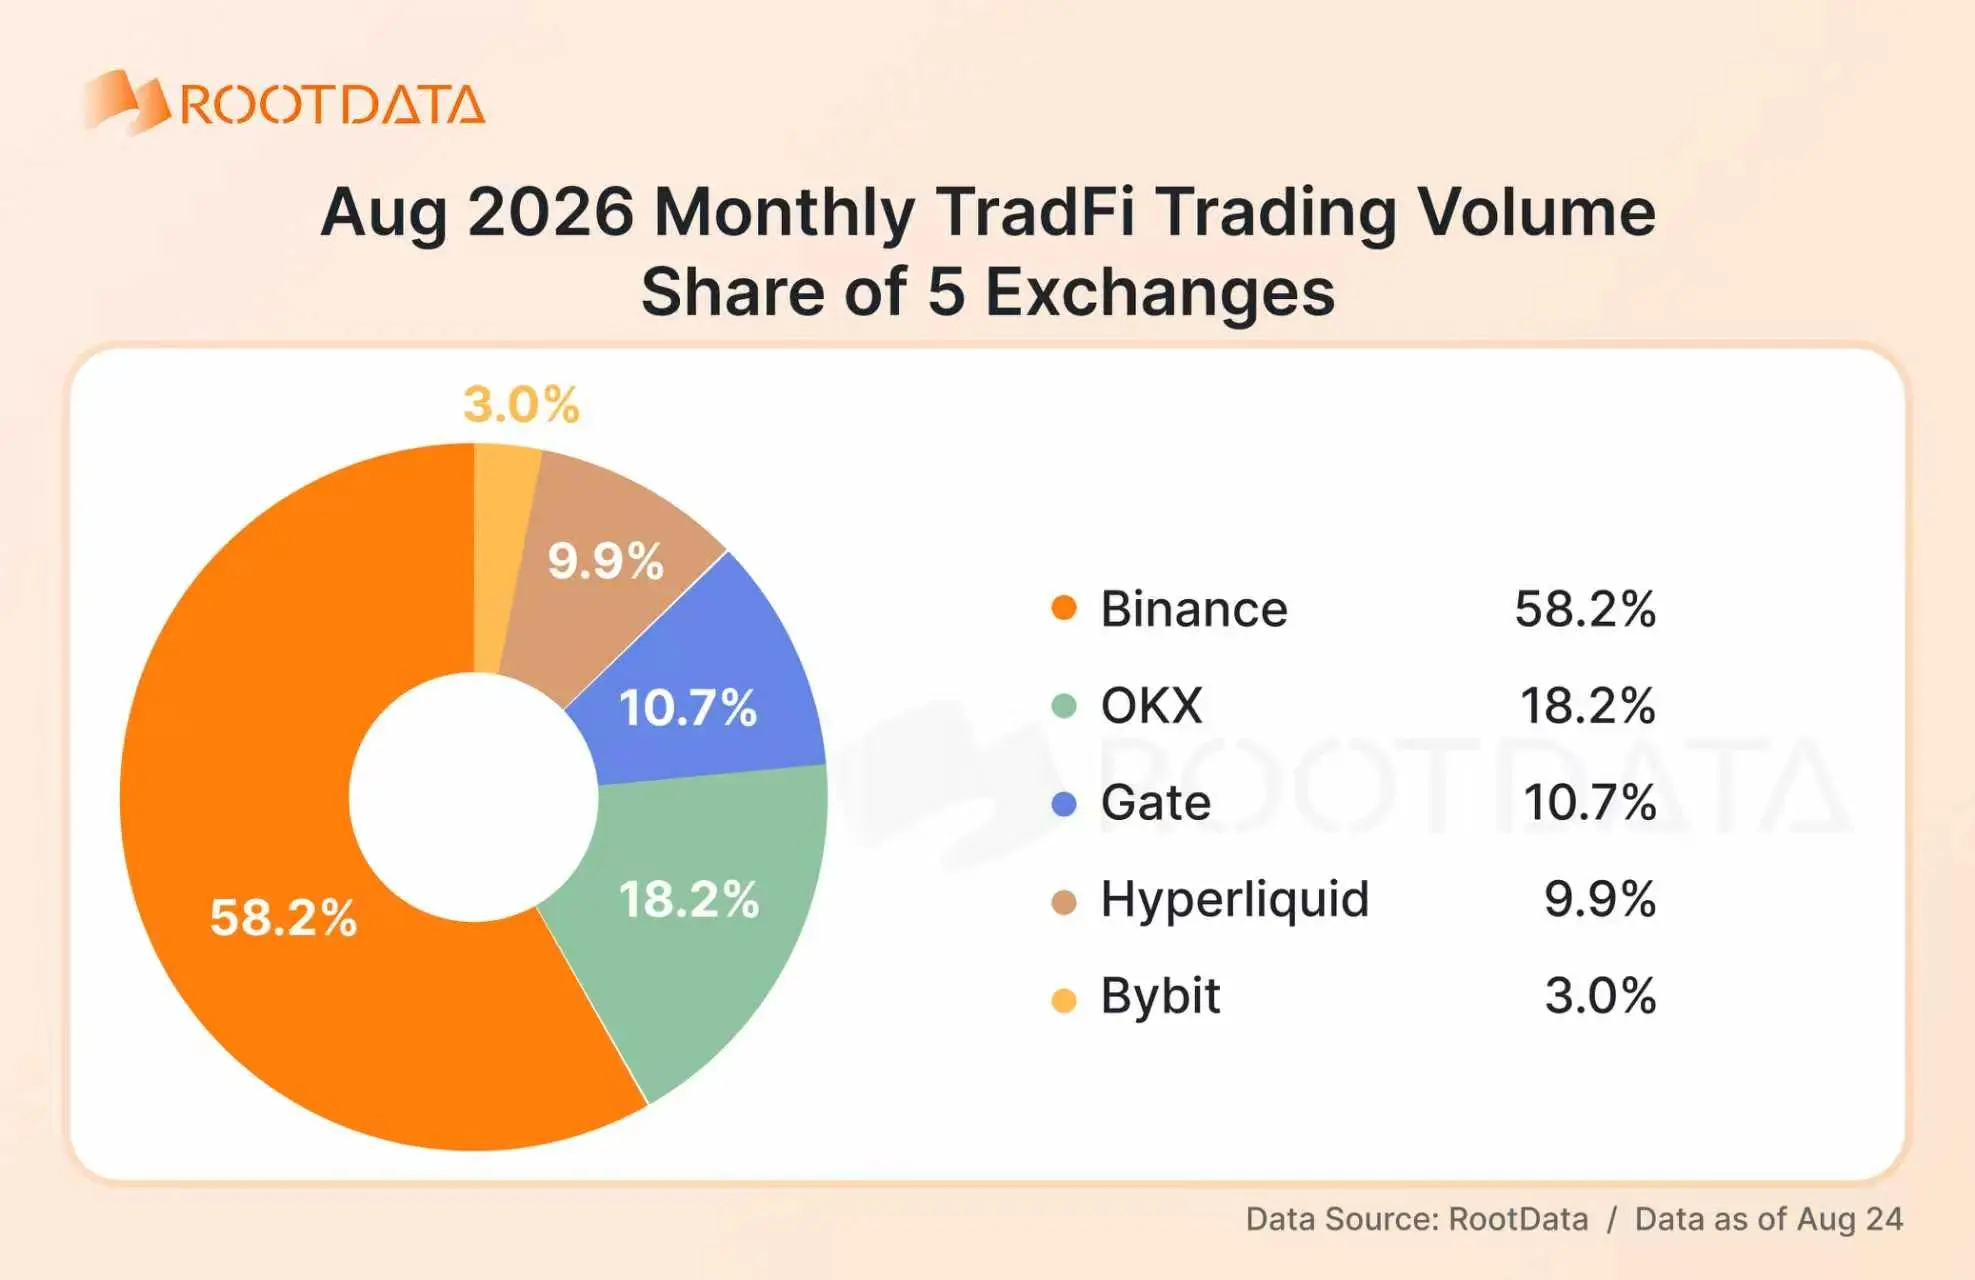
Binance ranked first with $1.29 trillion and a 68.3% market share, remaining the clear dominant player.However, on a monthly basis, Binance’s share gradually declined from 78.8% in January to 58.2% in August, a drop of more than 20 percentage points.
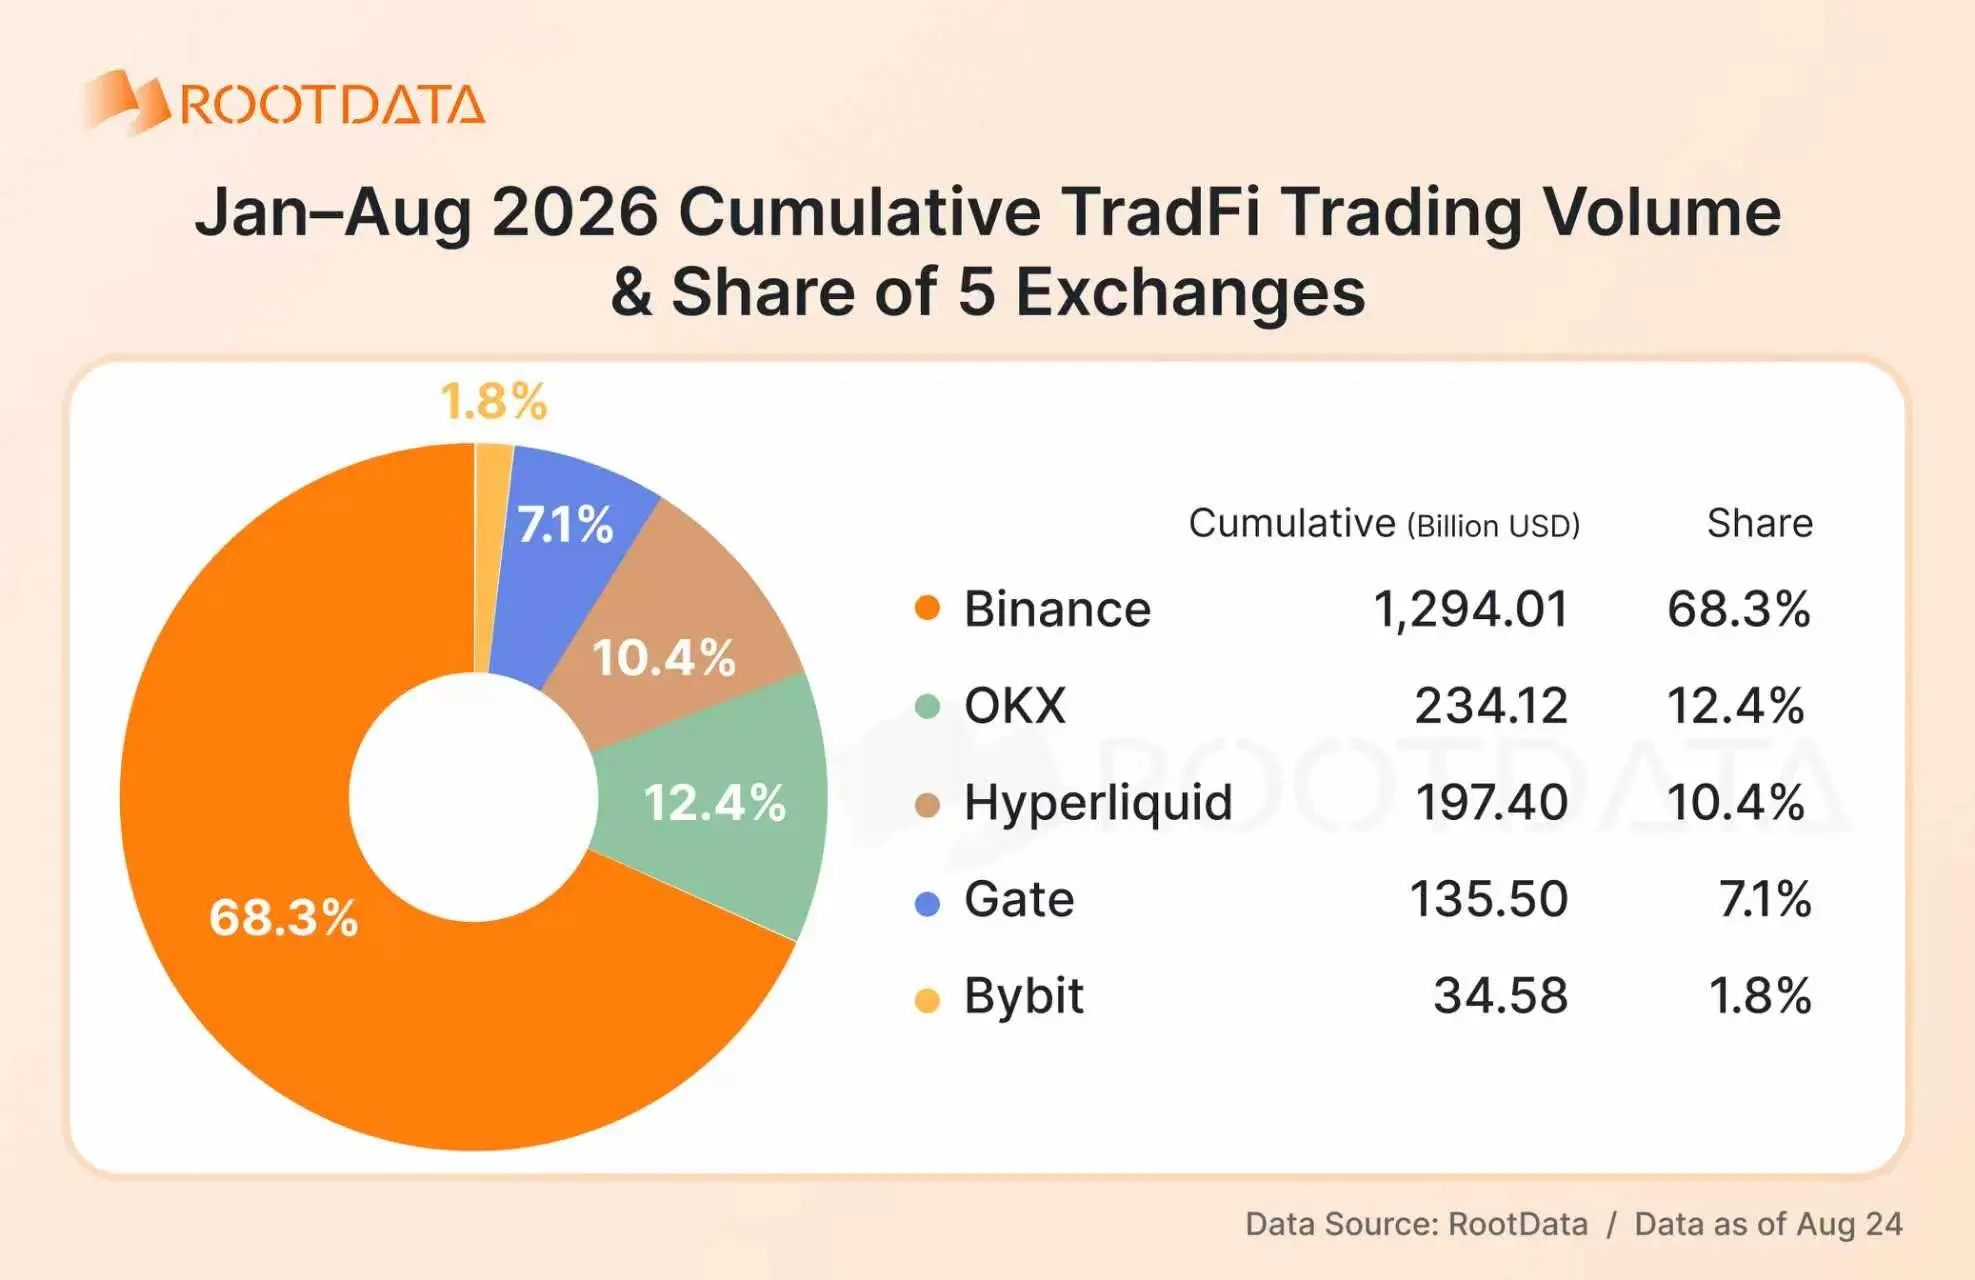
At the same time, the second tier is expanding rapidly.OKX went from almost no TradFi trading volume at the beginning of the year to an 18.2% share in August, moving into second place.Hyperliquid’s share rose to 10.7% in May and remained above 10% thereafter, reaching a peak of 13.3% in July.Gate’s share fluctuated between 3.7% and 13.5%, recovering to 10.7% in August.Bybit also climbed from 0.3% to 3.0%.
This means capital in the TradFi sector is no longer flowing predominantly toward a single platform, but is instead showing a clear trend toward multipolar distribution.
2. Open-Interest Retention: User Trading Preferences Diverge Across Platforms
In August, through August 24, combined average daily open interest in TradFi derivatives across the five exchanges was approximately $7.304 billion.Binance ranked first with $3.455 billion, accounting for 47.3%.Hyperliquid ranked second with $1.956 billion and a 26.8% share.Gate ranked third with approximately $903 million in average daily OI, accounting for 12.4%.OKX and Bybit accounted for 8.0% and 5.6%, respectively.
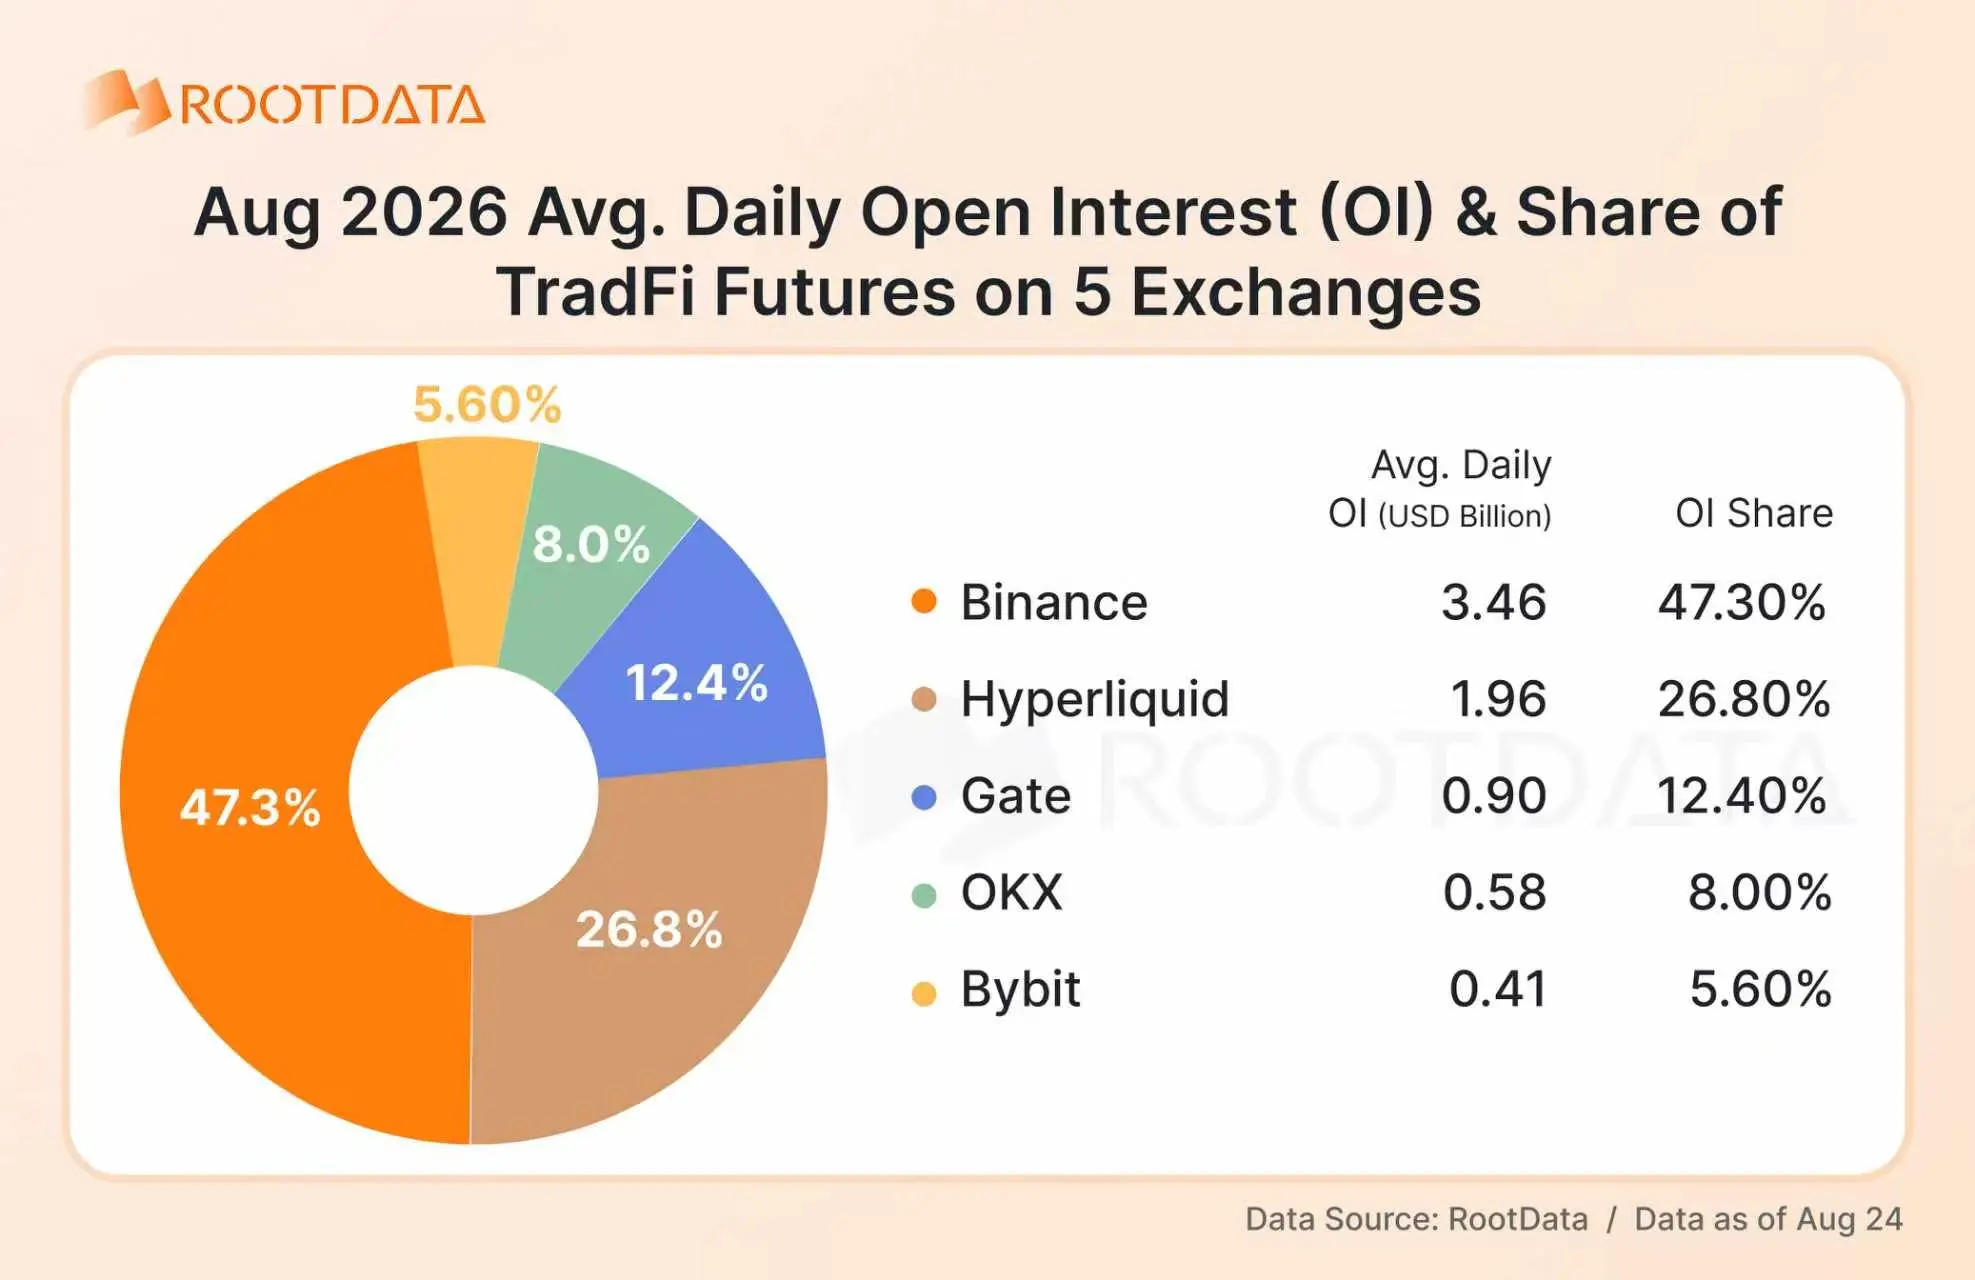
Hyperliquid’s share of OI, at 26.8%, was far higher than its share of trading volume, at approximately 9.9%, indicating that it retains significantly more open interest per unit of trading volume than other platforms.Gate’s 12.4% share of OI was also higher than its 10.7% share of trading volume.By contrast, OKX’s 18.2% share of trading volume was significantly higher than its 8.0% share of OI.This divergence shows that TradFi assets are being “used” in fundamentally different ways across platforms: some are more oriented toward high-frequency turnover, while others are more oriented toward retaining open positions.
3. Large Differences in Asset Coverage Reflect Different Expansion Strategies
According to the latest data as of August 24, the number of TradFi assets offered by the five exchanges shows a clear divergence.
Gate had 1,022 assets, followed by OKX with 242 and Binance with 229.Gate’s asset coverage was 4.2 times that of second-ranked OKX, representing a substantial gap.Behind this difference in scale are two distinctly different platform strategies.Gate follows a “broad coverage” strategy, offering the widest range of listed assets across several major global stock markets, including U.S., Hong Kong, South Korean, and Japanese equities.
It also lists assets relatively quickly, adding a large number of instruments at an early stage to meet cross-market and multi-theme allocation needs.Binance, OKX, Hyperliquid, and Bybit, by contrast, follow a more “selective” strategy, keeping the number of instruments within a range of roughly 100 to 250 and placing greater emphasis on concentrating market-making and liquidity resources around core assets.
III. How Is the Equity Derivatives Market Evolving?
1. Trading Volume: “One Dominant Leader, Multiple Strong Players” and Diverging Growth Momentum
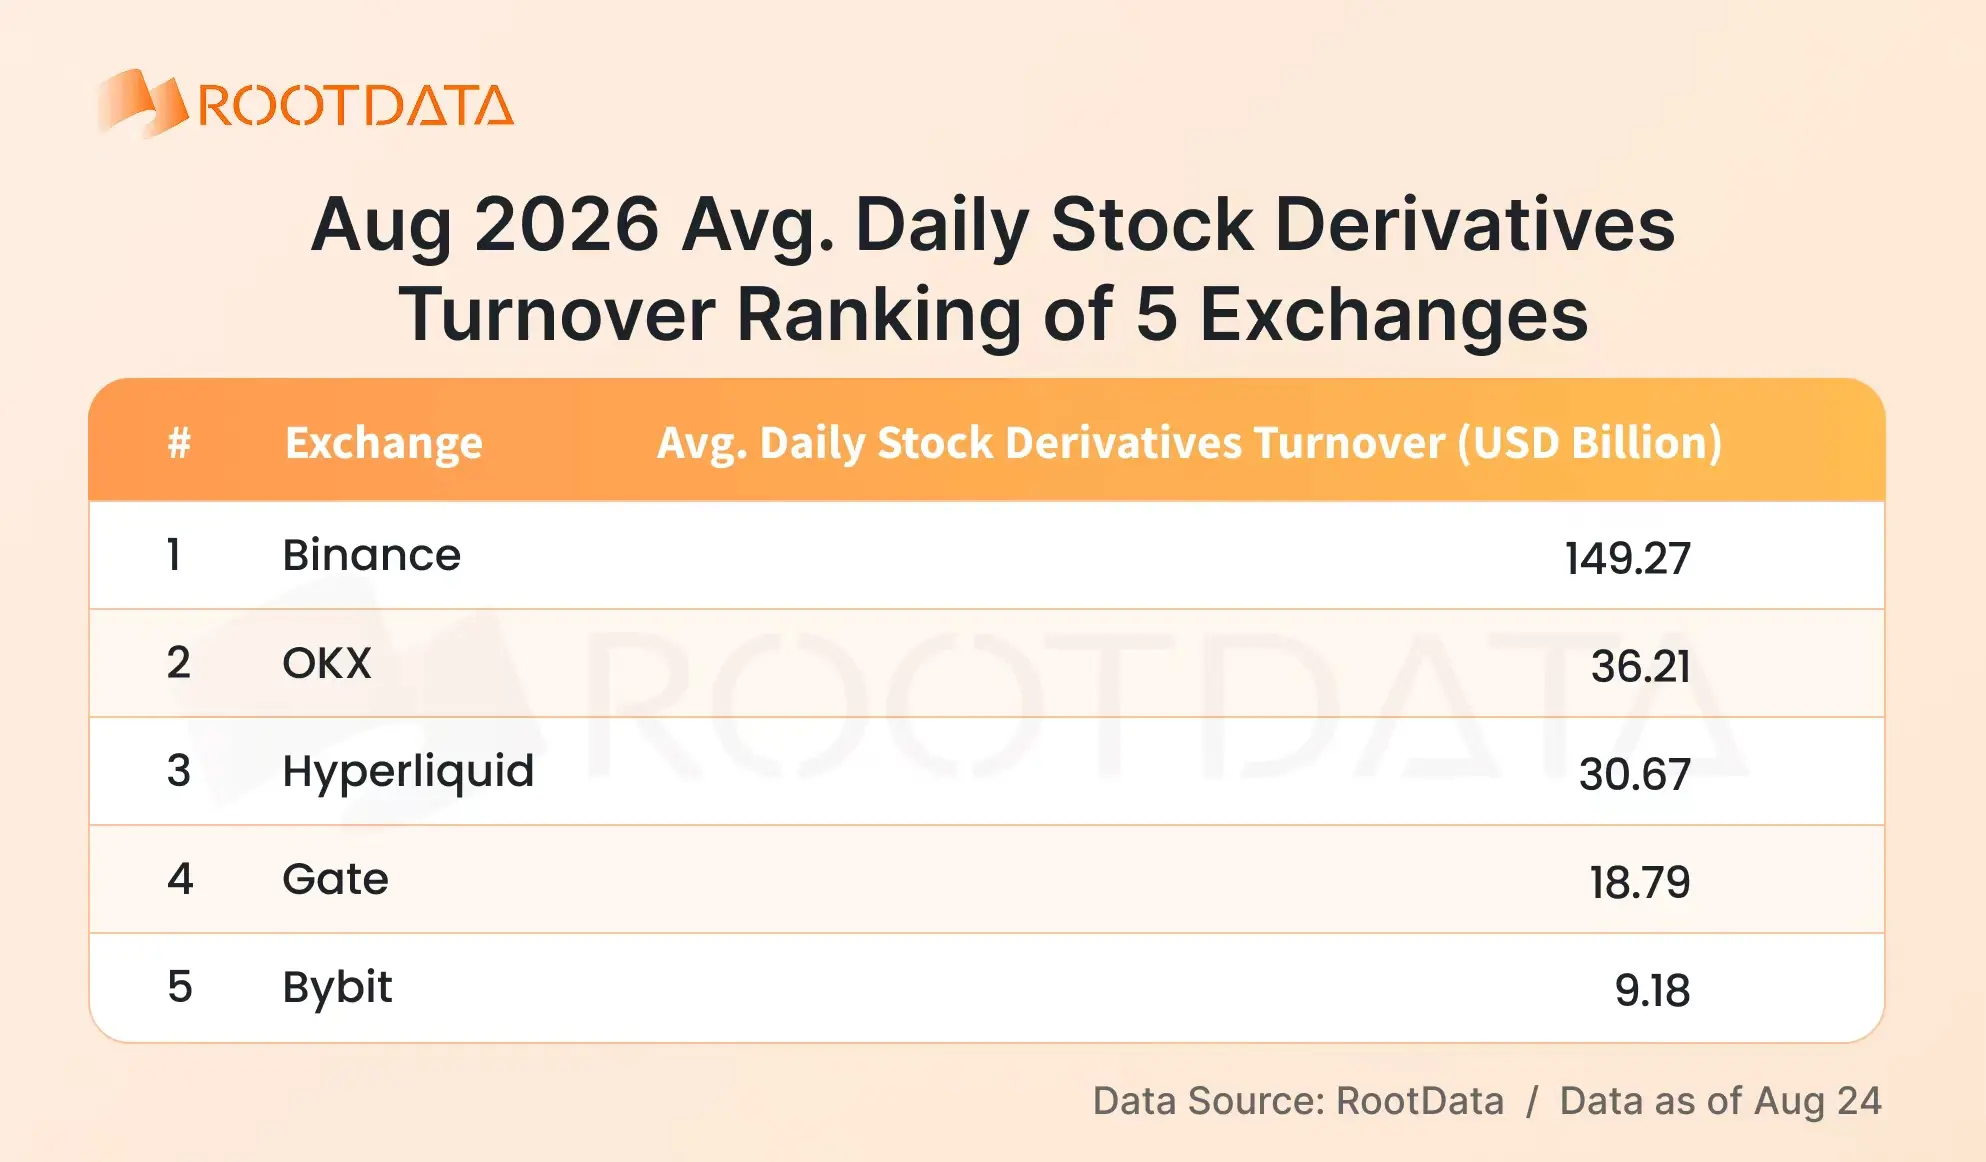
Trading volume remains the most direct measure of market position.Binance led by a wide margin with average daily trading volume of $14.927 billion, 4.1 times the $3.621 billion recorded by second-ranked OKX, giving it a dominant position.The industry therefore exhibits a typical structure of “one dominant leader and multiple strong players.”
OKX and Hyperliquid ranked second and third, with average daily trading volumes of $3.621 billion and $3.067 billion, respectively, placing them at roughly the same scale.Gate recorded average daily volume of $1.879 billion, while Bybit recorded $918 million.
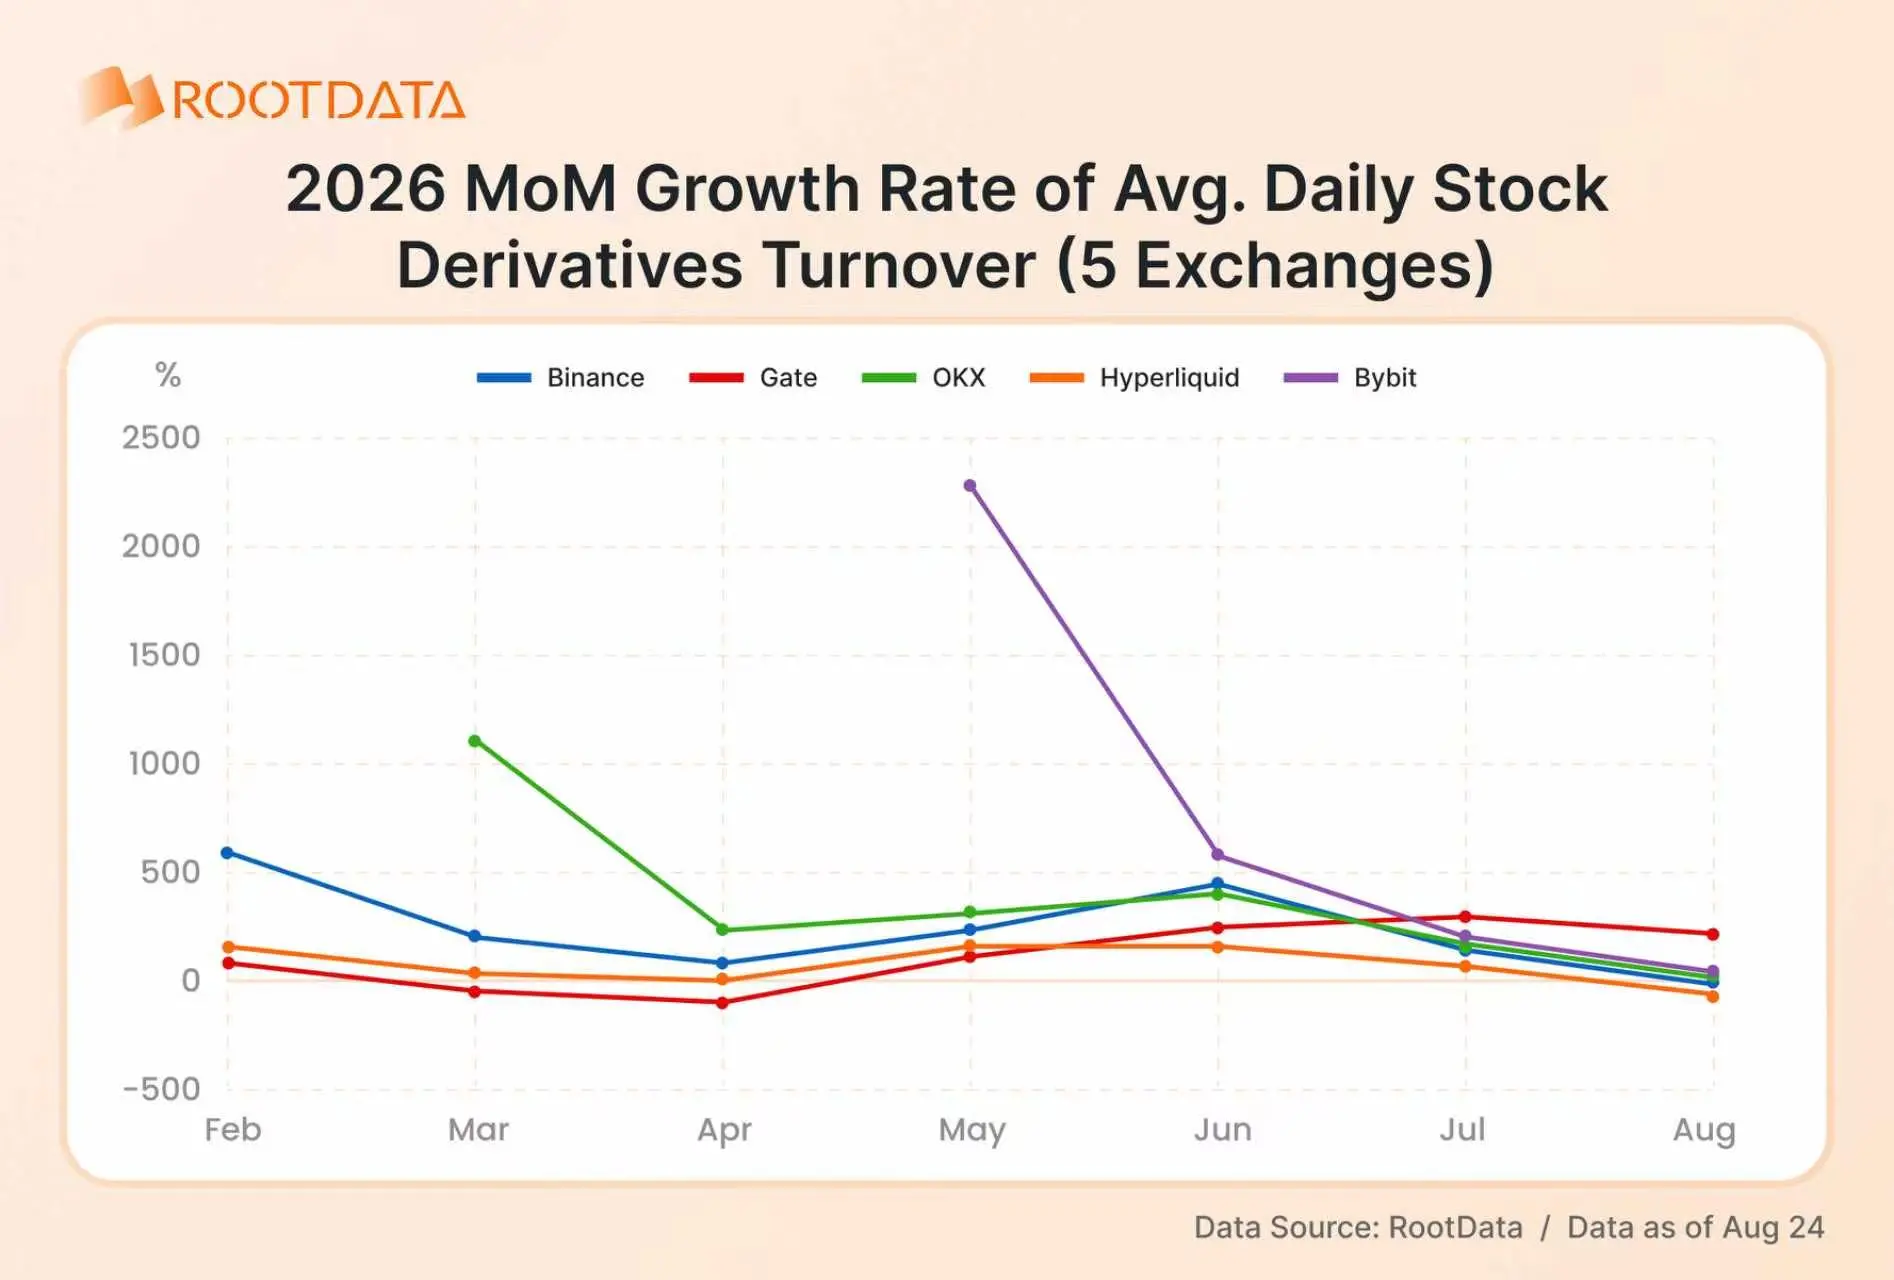
But trading volume is only one side of the story. Month-over-month growth rates also reveal trends in capital flows.Looking at month-over-month changes in average daily trading volume from February through August, industry growth peaked in June. In July and August, the market as a whole entered a period of absorbing the effects of a “high base.”Against this backdrop, growth momentum across platforms diverged significantly.As the clear market leader, Binance recorded month-over-month growth of 467.9% in average daily trading volume in June. This fell to 116.5% in July and declined further to 2.1% in August through August 24.
Binance therefore faces both the advantage of its scale and pressure on its growth rate, although its scale advantage remains firmly intact.Hyperliquid showed a similar pattern, with stronger growth earlier and weaker growth later.OKX and Bybit maintained positive growth, but their growth rates had narrowed significantly from their peaks in May and June.
Gate’s growth trajectory, by contrast, followed a different pattern.Beginning in May, it continued to accelerate, recording month-over-month growth in average daily trading volume of 124.1%, 187.3%, 323.7%, and 261.1% from May through August, respectively.It maintained triple-digit growth for four consecutive months.Whether this sustained growth can translate into a further rise in rankings by absolute scale will depend on base effects and capital retention in the months ahead.
2. Open-Interest Structure: Diverging Long- and Short-Term Strategies
In terms of open interest, Binance remained firmly in first place with average daily OI of $3.472 billion.Hyperliquid followed with $1.986 billion, equivalent to 57% of Binance’s level.Gate ranked third with average daily open interest of $772 million.OKX and Bybit recorded $532 million and $194 million, respectively.
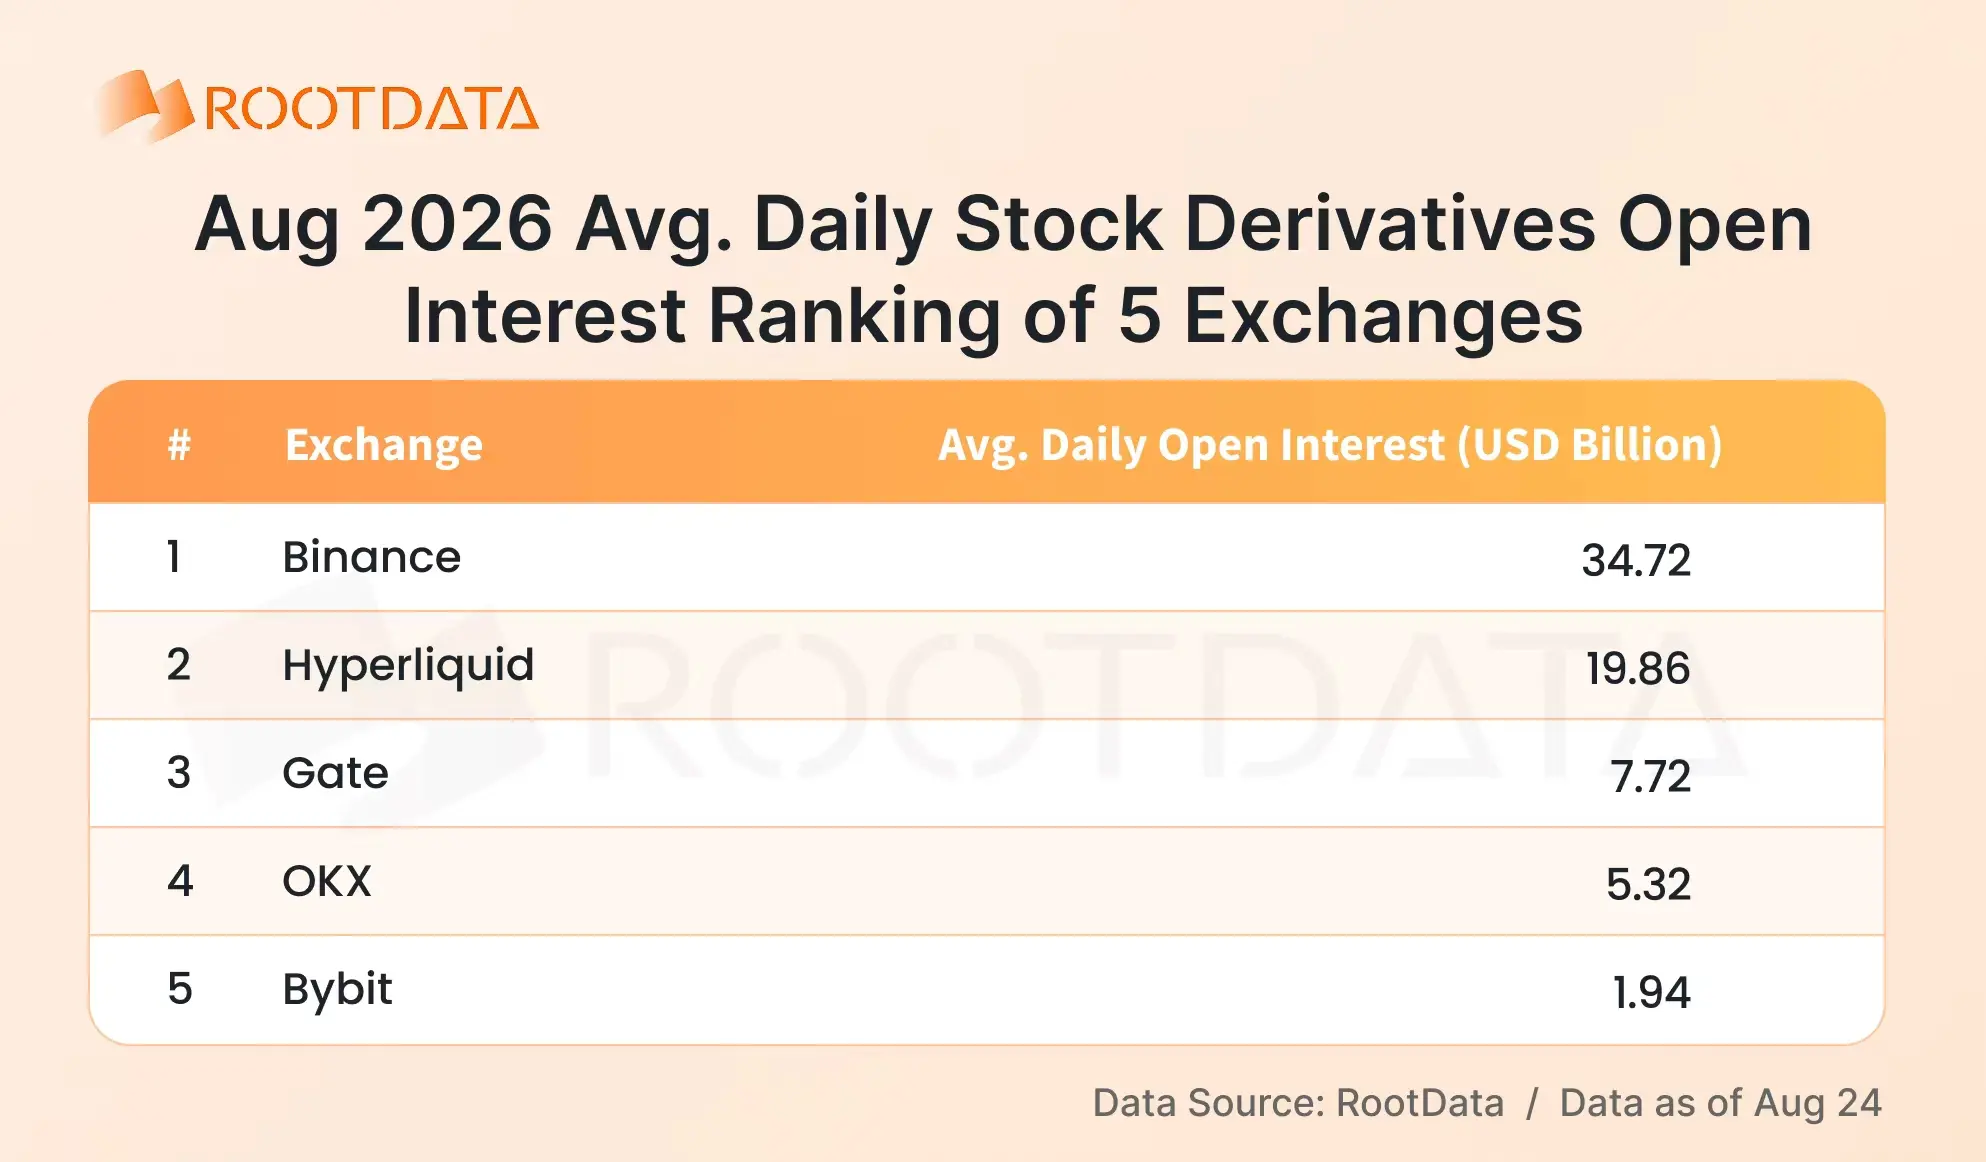
The OI-to-trading-volume ratios across platforms show a clear divide in user behavior.Hyperliquid’s ratio was approximately 0.65, with users tending to hold positions for longer after opening them, displaying a typical allocation-oriented profile.Gate’s ratio was approximately 0.41, reflecting a relatively balanced mix of long- and short-term strategies.OKX’s ratio was only around 0.15, while Binance’s was approximately 0.23, with both platforms leaning more toward higher-frequency short-term trading.
3. Order-Book Depth: Gate Ranked First in Liquidity in Mid-August, Overtaking Binance for 11 Consecutive Trading Days
According to liquidity monitoring data, since August 14, Gate's ±2% weighted depth has surpassed Binance for 11 consecutive trading days, ranking first in the industry. During this period, Gate's average daily weighted depth reached $14.678 million, while Binance's was $10.721 million.
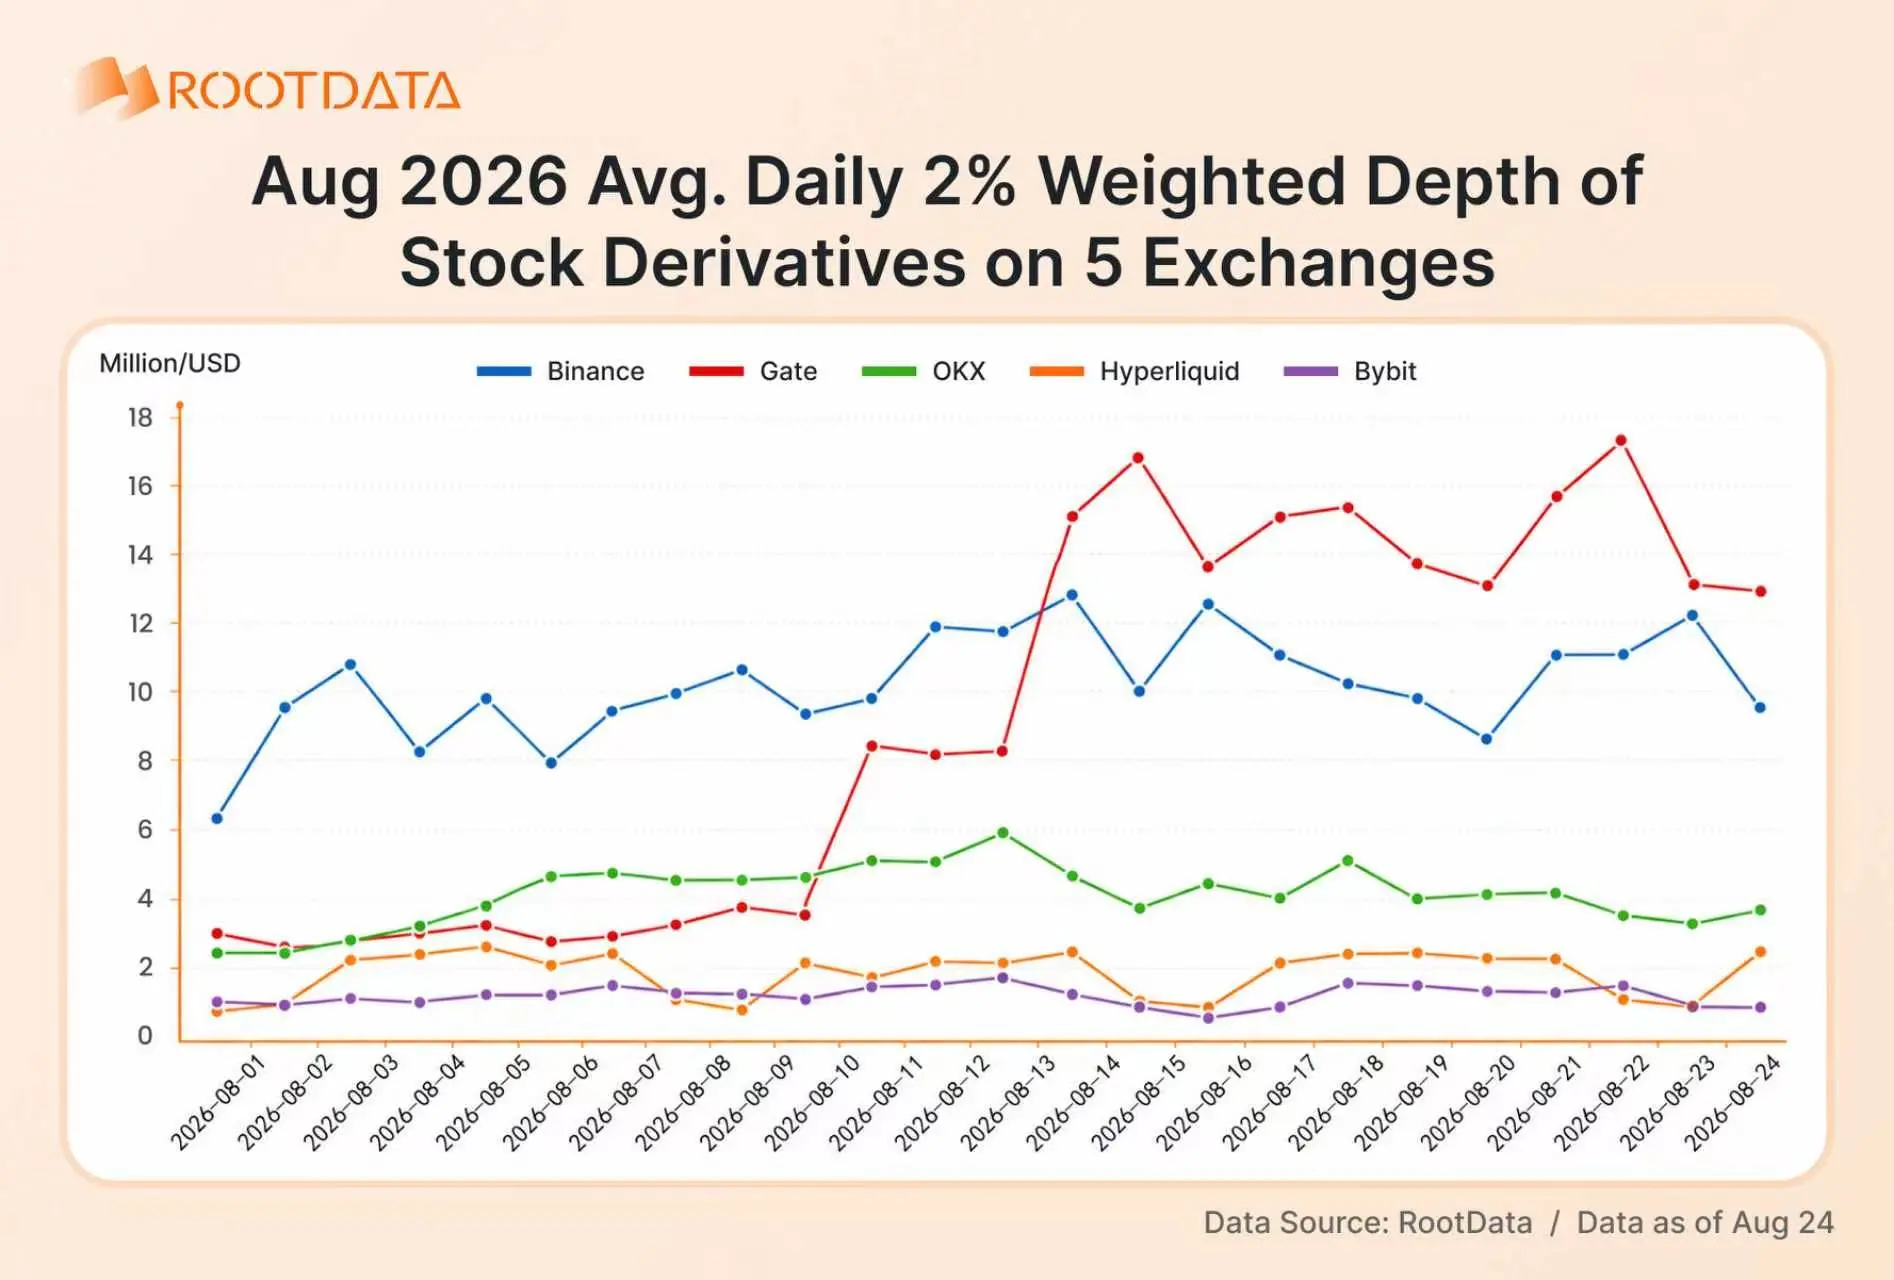
Using weighted ±1% depth, which more closely reflects the range in which actual trading takes place, Gate also remained in first place after August 10, with an average daily figure of $7.4986 million.Together, Gate and Binance accounted for approximately 71% of liquidity across comparable exchanges, further highlighting the concentration of liquidity among the leading platforms.
Before this, the industry as a whole had displayed a “two-leader concentration” structure.Binance had long ranked first with average daily weighted ±2% depth of $10.0691 million, followed by Gate with $9.0123 million.Together, the two accounted for more than 70% of industry depth.OKX, Bybit, and Hyperliquid followed with $4.0445 million, $1.7886 million, and $1.1713 million, respectively, leaving a clear gap between them and the leading platforms.
4. Spreads Among Leading Exchanges Remain Relatively Stable
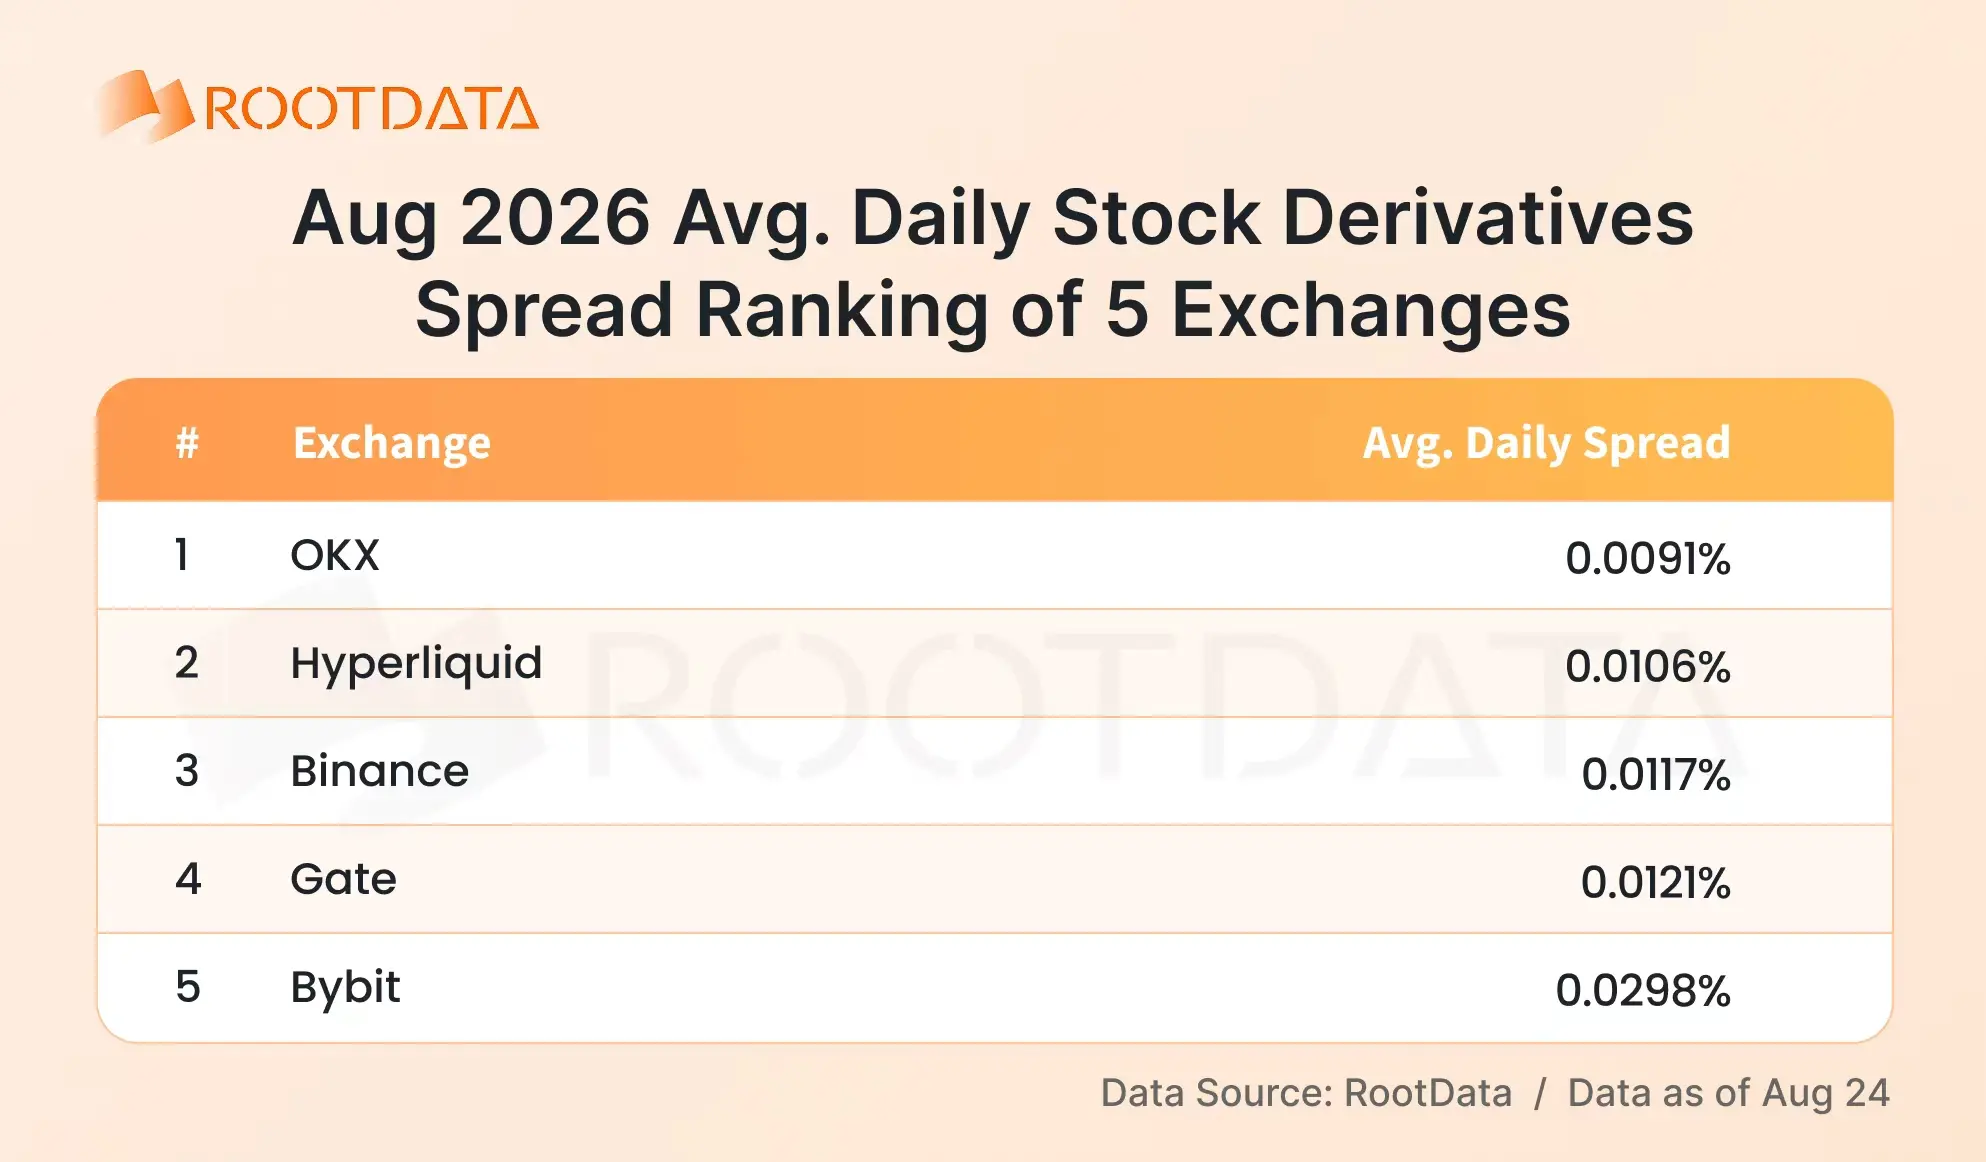
Trading costs are also an important factor affecting the trading experience.OKX had the lowest weighted spread at 0.0091%, followed by Hyperliquid at 0.0106%.Binance, at 0.0117%, and Gate, at 0.0121%, were at almost the same level, ranking third and fourth, respectively.Bybit trailed at 0.0298%.
Overall, however, spreads among the leading exchanges remained relatively stable.One development worth noting is that Gate’s spreads narrowed significantly beginning August 18.For five consecutive days, its spreads remained within a range of 0.0043% to 0.0086%, the best level among all platforms during that period.
5. Product Matrix: Who Is Expanding Breadth, and Who Is Going Deeper?
When trading costs are compressed to extremely low levels, the number of instruments a platform can offer becomes the next dimension of competition.A snapshot from August 24 shows Gate ranking first with 366 equity derivatives instruments, followed by Bybit with 206, Binance with 170, OKX with 156, and Hyperliquid with 116.If the scope is expanded to CFDs, Gate had listed 663 CFD trading assets by the second quarter of 2026, with peak weekly trading volume exceeding $150 billion, placing it among the leading crypto platforms globally.
But the number of products reflects only one side of asset coverage. The other is the actual share captured in popular assets.Using four leading instruments—SNDK, SK Hynix, MU, and SPCX—as examples, RootData’s tokenized-asset data as of August 24 shows clear differences in the competitive positions of the platforms.
Binance is the absolute center of trading activity and open positions.It ranked first in 24-hour trading volume across all four instruments and ranked first in OI for three of them.However, its advantage is concentrated in “volume.” It does not have a clear advantage in spreads or leverage, with spreads on most instruments only ranking in the second tier.Its depth advantage in individual memory-sector stocks has even been overtaken by competitors.
Across the four instruments, Gate tied for the lowest spread in all four.Its spread was as low as 0.0007% for SNDK and 0.0009% for SK Hynix.It also offered the highest maximum leverage, at 75x, on three of the four instruments.More importantly, its order books showed greater capacity to absorb larger trades in key instruments.SK Hynix had ±2% liquidity depth of $2.45 million on Gate, 5.9 times Binance’s level and four times Bybit’s.MU depth reached $6.5 million, ranking first among the five exchanges, 19% higher than Hyperliquid and 51% higher than Binance.
Hyperliquid, meanwhile, showed strong depth and position accumulation, but no clear advantage in spreads.Its SNDK depth of $7.72 million ranked first among all platforms, while its MU depth ranked second.It also ranked first in OI for MU, but its spreads on both SNDK and MU were noticeably wider.
6. Multi-Dimensional Radar: Summary of the Cross-Platform Comparison
Across the six dimensions, the current equity derivatives exchange landscape shows clear differentiation.
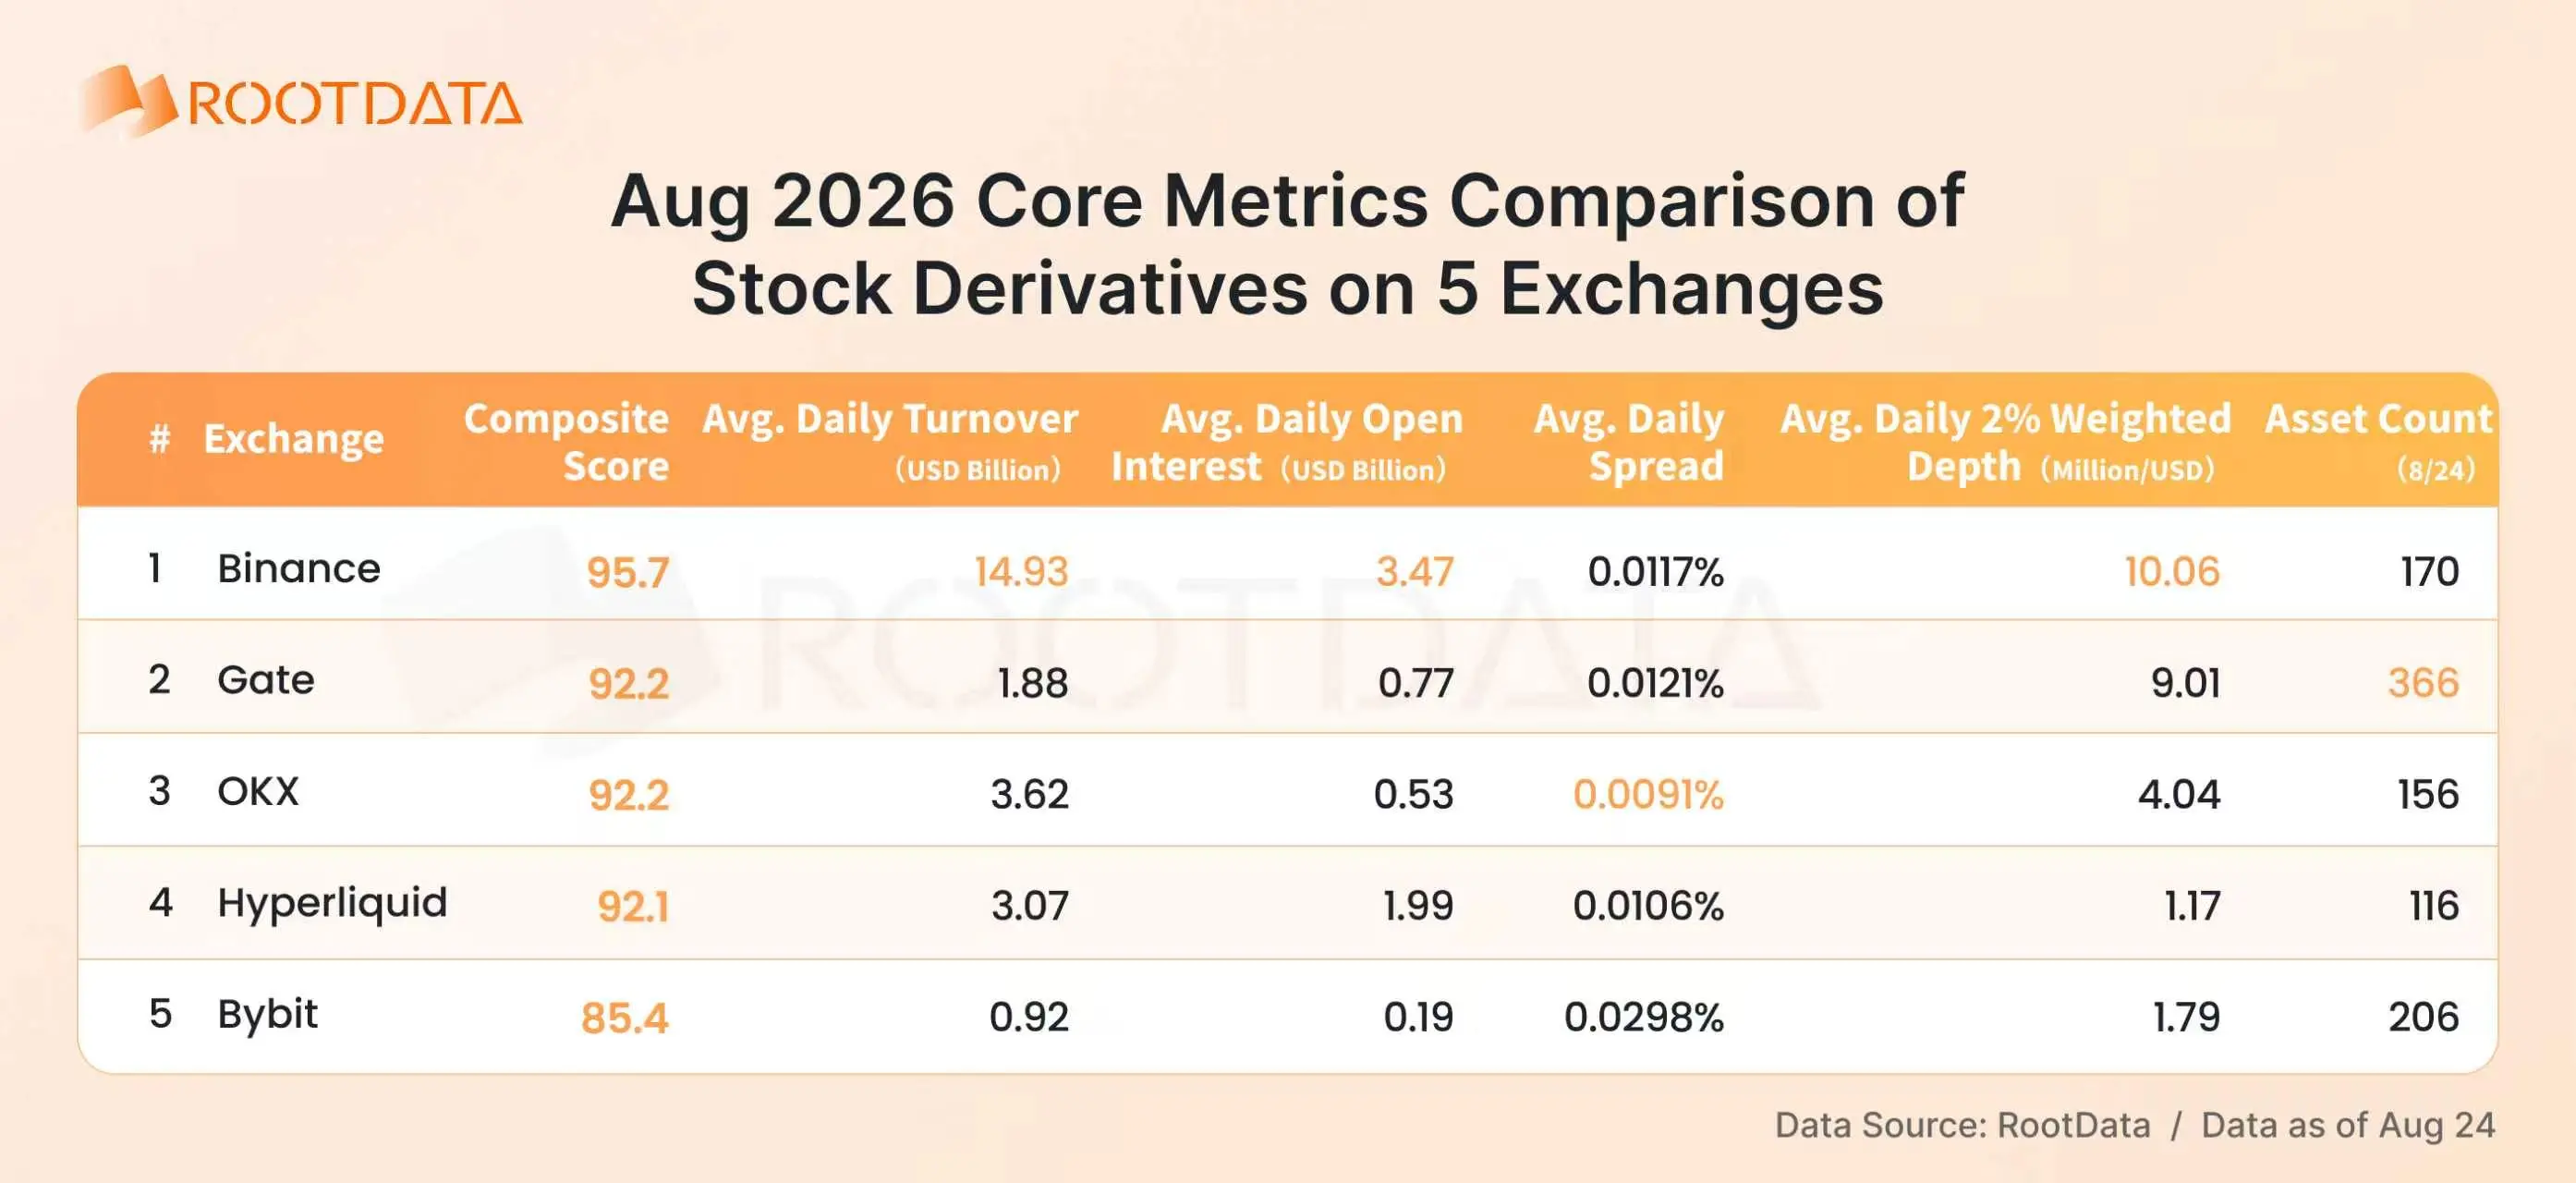
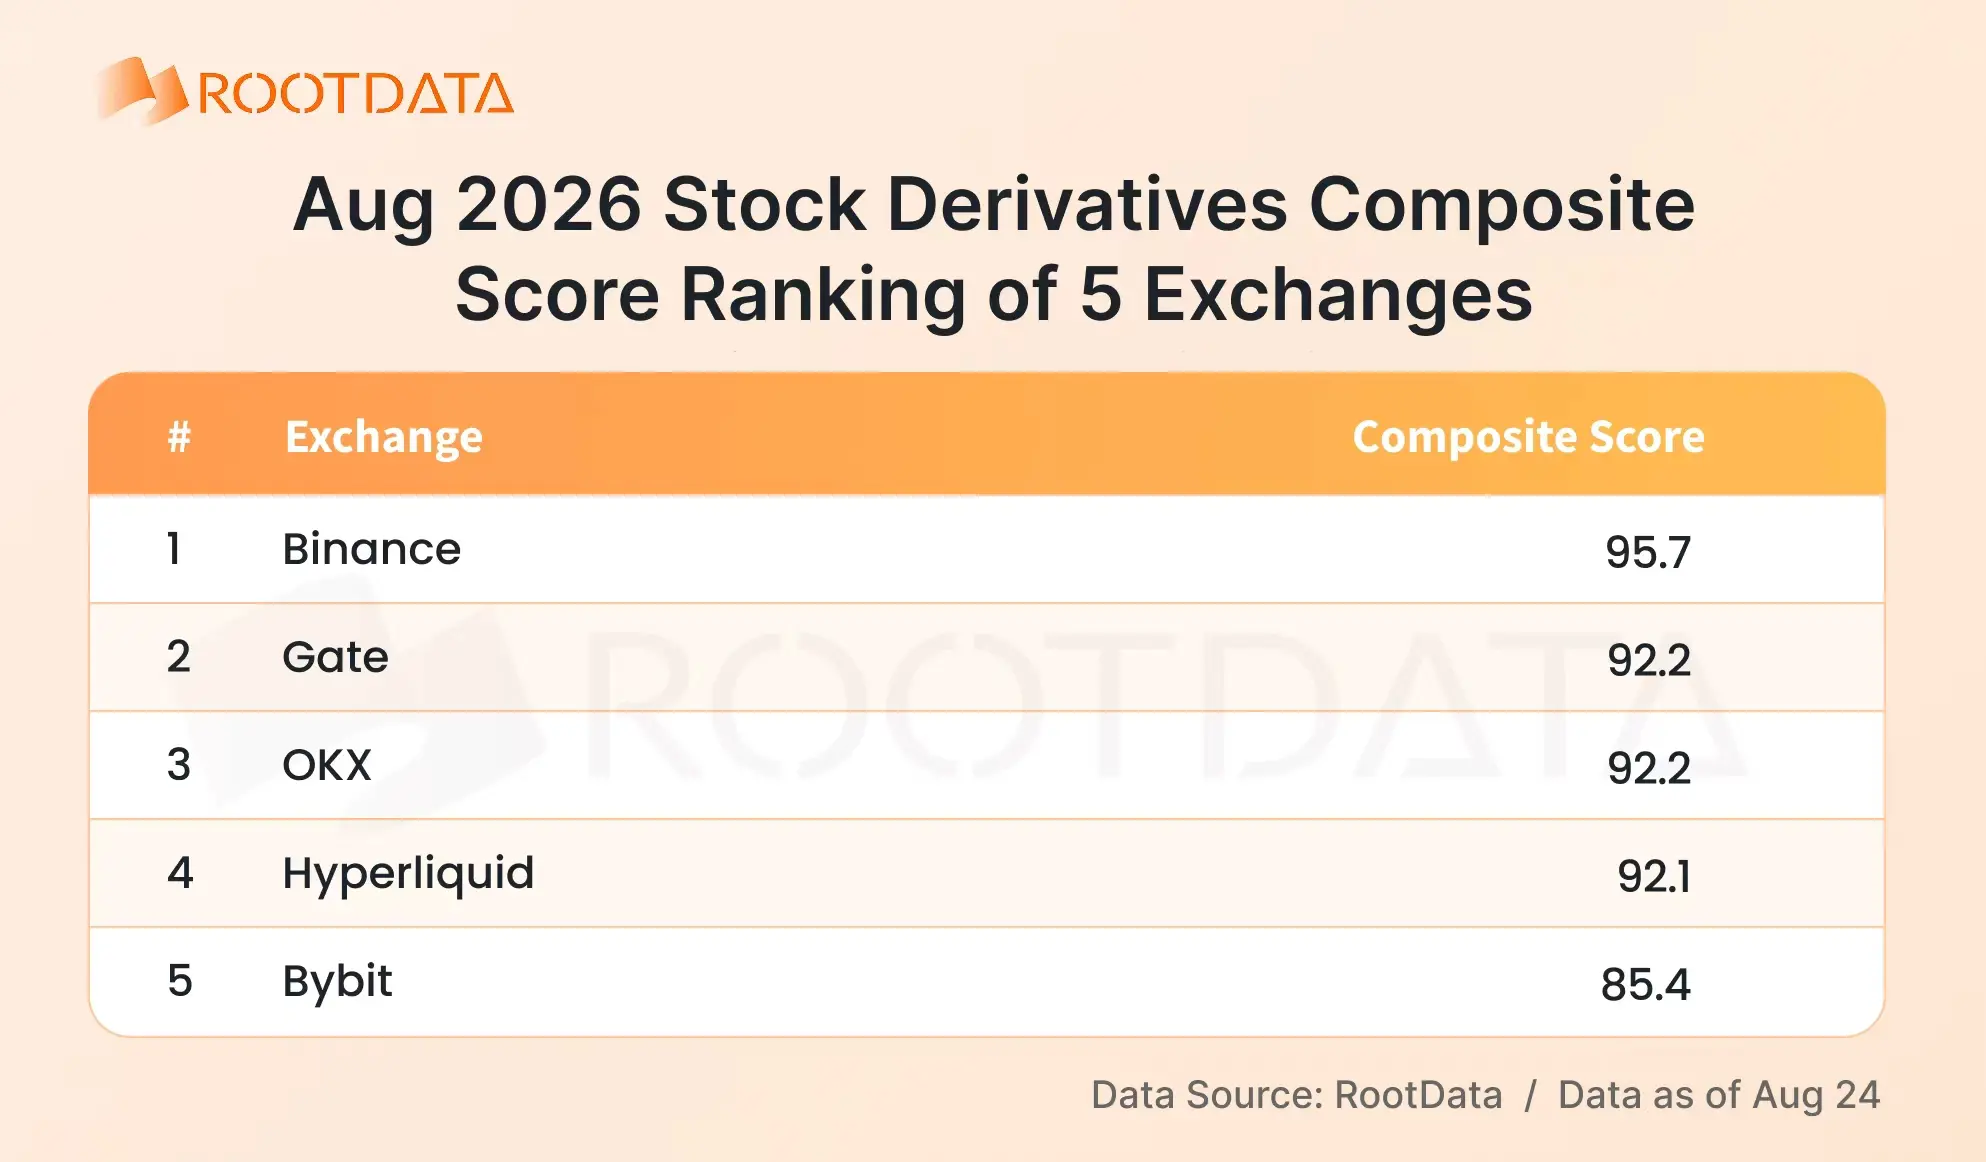
Binance ranked first in four categories: overall score, average daily trading volume, average daily open interest, and average daily ±2% weighted depth.It is currently the primary venue for equity-derivatives liquidity and occupies an irreplaceable central role in broad-based underlyings.
Gate tied for second in overall score and ranked second in average daily ±2% weighted depth.It ranked first in asset count with 366 instruments, while also recording the highest month-over-month growth among the five exchanges in both July and August.It has been active in both the breadth of product coverage and growth momentum.
OKX tied for second in overall score and had the lowest average daily spread among the five exchanges, at 0.0091%.It performed particularly well in terms of trading costs and is attractive to traders who place a high priority on quote quality.
Bybit ranked second in asset count, while ranking fourth or fifth across the other dimensions.Its overall scale remains below that of the leading platforms, and its expansion in the equity derivatives segment is still at an earlier stage.
IV. Conclusion
In 2026, TradFi assets have rapidly grown from a peripheral category into a core sector generating hundreds of billions of dollars in monthly trading volume.Cumulative TradFi asset trading volume on crypto exchanges reached $1.3 trillion in the first half of the year, marking an acceleration in the erosion of boundaries between crypto platforms and traditional financial markets.
The exchange landscape is evolving at the same time.Binance remains the absolute center of trading activity and open positions, but its share of trading volume has fallen from 78% at the beginning of the year to below 60% in August.The market is moving from “unipolar concentration” toward “multipolar distribution.”
OKX has rapidly built trading volume in part through lower trading costs, while Hyperliquid has attracted longer-term capital through high levels of retained open interest.The two have established barriers respectively on the cost side and the allocation side.
Gate is another variable in this landscape that warrants continued attention.Its overall scale remains some distance behind Binance, but its overall operating performance is relatively balanced, and its recent growth rate has been in a relatively leading position.For some individual assets, its liquidity depth and spreads have already become competitive.
Looking ahead to the second half of the year, the logic of competition in the TradFi sector is shifting away from simply asking which platform has more trading volume.Instead, competition is increasingly centered on which platforms can continue to improve across multiple dimensions of the trading experience, including better pricing and deeper order books for core assets.
Platforms that secure these positions early will be more likely to capture the next wave of incremental growth.
 Risk warning