Coinbase: In-depth analysis of Bitcoin trends after this halving

 The current price trend is just the beginning of a long-term bull market, and the upward trend in prices needs to advance further to drive the supply and demand dynamics to reach equilibrium.
Original Title: Monthly Outlook: Bitcoin Halvings -- Supply, Demand and Statistics
Authors: David Duong (Head of Institutional Research), David Han (Institutional Research Analyst)
Overview
- As the fourth Bitcoin halving approaches, we believe that studies of previous cycles should be interpreted with caution due to the small sample size, making it difficult to generalize their patterns to the imminent future.
- The U.S. spot Bitcoin ETF has also reshaped Bitcoin's market dynamics by establishing a new anchor point for BTC demand, making this cycle unique.
- We believe that the current price trend is just the beginning of a long-term bull market, and the upward price momentum needs to advance further to push the supply-demand dynamics toward equilibrium.
We are just over a month away from Bitcoin's fourth halving. Like all previous halvings, it will reduce the Bitcoin issuance reward for miners by half, this time from 6.25 BTC per block to 3.125 BTC. While studying past halving cycles can provide some reference for Bitcoin's potential price trajectory, we believe that the sample size of three events is too small to provide sufficient data to structure a clear pattern or make definitive predictions about the impact of the halving.
Furthermore, we believe that the emergence of the U.S. spot BTC ETF has fundamentally changed Bitcoin's market dynamics. In just two months, its net inflow has reached billions of dollars, irreversibly altering the landscape. Now, major institutional participants can invest through these tools, and Bitcoin's reaction to this halving may not necessarily reflect the performance of the previous three cycles. We think it is more important to understand the current technical supply-demand situation, as it can help us better grasp Bitcoin's potential.
In fact, while the new Bitcoin supply constraints are an important consideration, they are just one of many factors. Since the beginning of 2020, the available Bitcoin for trading (the difference between circulating and illiquid supply) has been declining, which is a significant change compared to previous cycles. However, recent data indicates that since the beginning of Q4 2023, the active BTC supply (Bitcoin that has moved in the past three months) has increased by 1.3 million, while only about 150,000 new Bitcoins have been mined during this period. Although the market is more capable of absorbing this supply than in the past, we still believe that a cautious approach is to avoid oversimplifying the complex interactions between these market dynamics.
Background
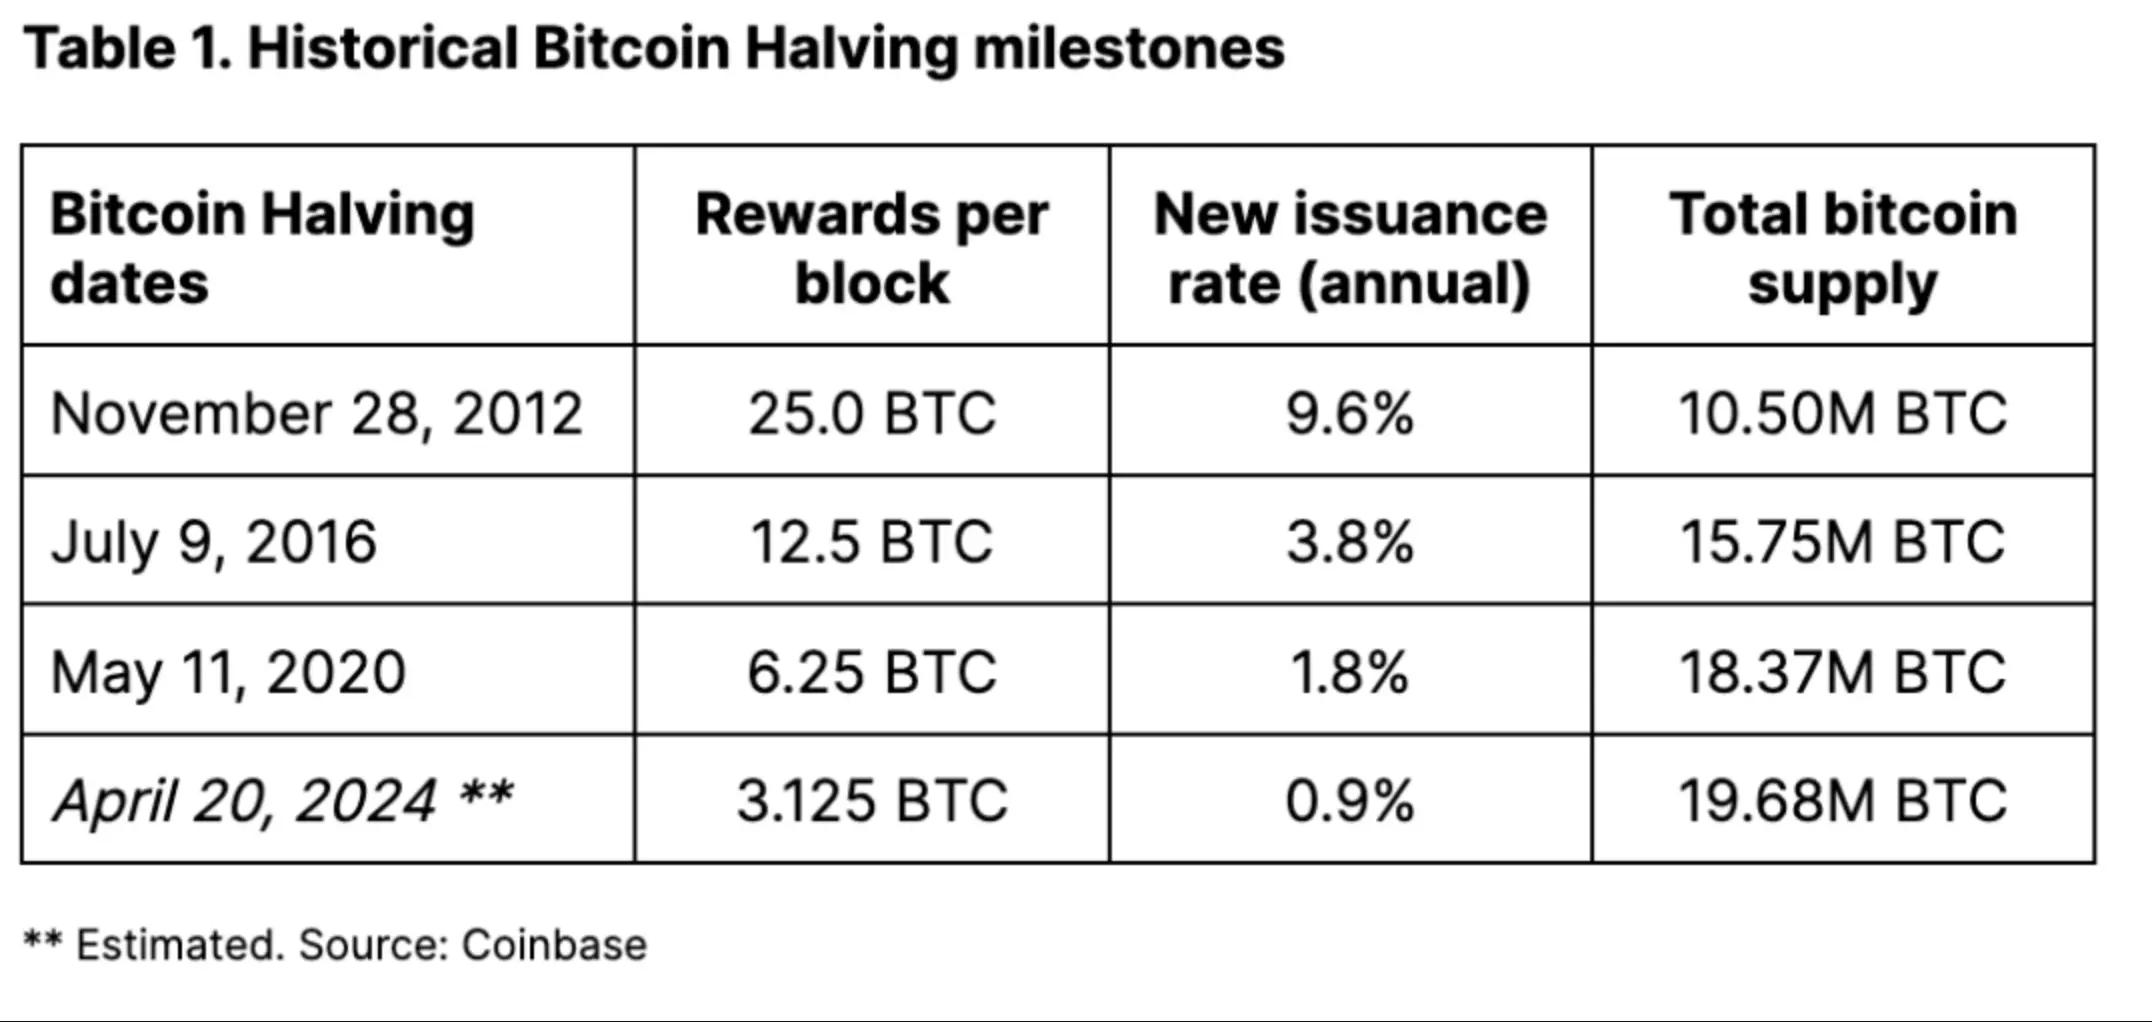
Every time 210,000 blocks are mined, the Bitcoin miner reward is halved, occurring approximately every four years (the exact date and time depend on the network hash rate, which is the computational power used to process transactions and mine new blocks, but this halving is expected to occur between April 16 and 20 of this year). This halving will reduce the total Bitcoin issuance from about 900 Bitcoins per day (implying an annual issuance rate of 1.8%) to about 450 Bitcoins per day, meaning the annual issuance rate will drop from 1.8% to 0.9%. After the halving, Bitcoin's monthly production will be approximately 13,500, with an annual production of about 164,250 (the exact numbers depend on the actual hash rate).
The halving will continue according to a predictable mechanism until all 21 million Bitcoins are mined, which is expected to occur around 2140. We believe the potential significance of the halving lies in its ability to increase media attention on Bitcoin's uniqueness: a fixed, deflationary supply schedule that ultimately creates a hard cap on supply.
This point is often underestimated. For physical commodities, such as minerals, theoretically, more resources can be invested in mining and extracting more minerals, such as gold or copper, even if the barriers may be high, but when prices rise, it will help meet demand. However, due to the predetermined block rewards and difficulty adjustment mechanisms, Bitcoin supply is inelastic (i.e., insensitive to price). Additionally, Bitcoin is a growth story. The utility of the Bitcoin network expands with the number of users on the network, which directly affects the value of the token. In contrast, purchasing precious metals like gold does not carry such growth expectations.
History Does Not Repeat Itself, But…
Analyzing the impact of halving cycles on Bitcoin's performance is limited because our experience is confined to three halving events. Therefore, studies of the correlation between previous halving events and Bitcoin prices should be interpreted with caution due to the small sample size, making it difficult to patternize solely from historical analysis. In fact, we believe that more halving cycles are needed to draw stronger conclusions about how Bitcoin "typically" reacts to halvings. Moreover, correlation does not imply causation, as factors including market sentiment, adoption trends, and macroeconomic conditions can all lead to price fluctuations.
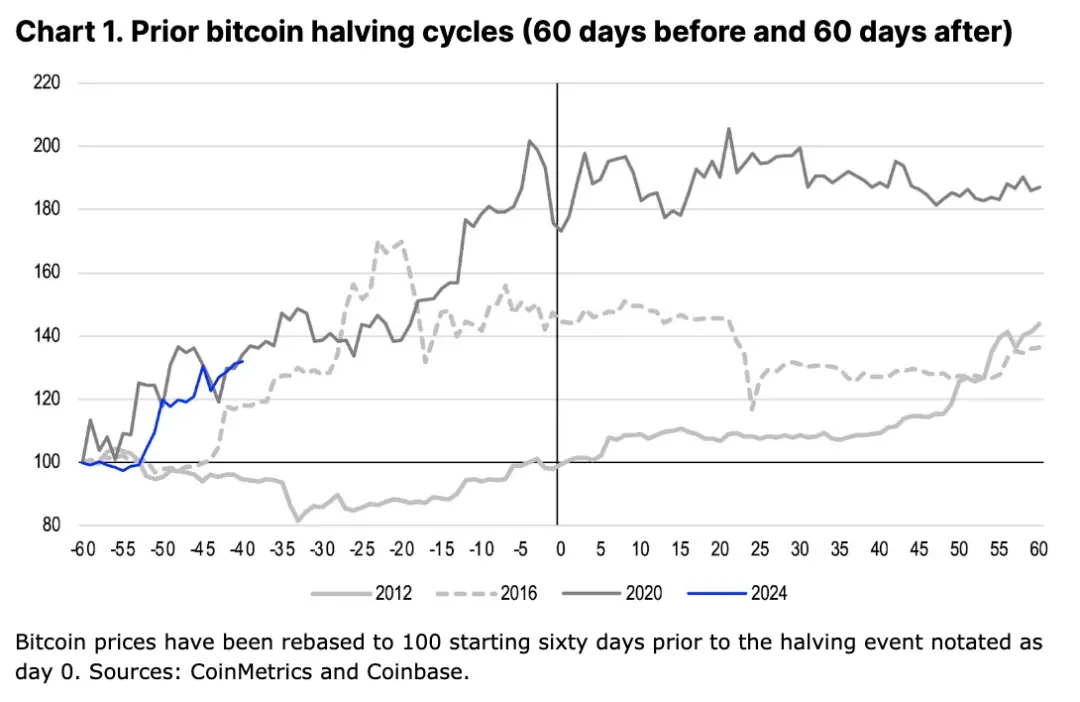
Indeed, we previously believed that Bitcoin's performance in past halving events likely depended on context. This may explain why the price movements during different cycles have varied so greatly. As shown in Figure 1, Bitcoin's price remained relatively stable in the 60 days leading up to the first halving in November 2012, while in the same periods before the second and third halvings in July 2016 and May 2020, Bitcoin's price rose by 45% and 73%, respectively.
In our view, it was not until January 2013, when the effects of the Federal Reserve's quantitative easing program (QE3) intertwined with the U.S. debt ceiling crisis, that the favorable impact of the first halving truly became apparent. Therefore, we believe that increased media coverage of the halving may enhance awareness of Bitcoin as an alternative store of value in response to widespread inflation concerns. In contrast, in 2016, Brexit may have triggered public financial concerns about the UK and Europe, which could have catalyzed Bitcoin purchases. This trend then continued during the ICO boom in 2017. By early 2020, global central banks and governments responded to the COVID-19 pandemic with unprecedented stimulus measures, significantly increasing Bitcoin's liquidity once again.
It is also important to note that analyses of historical performance can vary greatly depending on the observation period relative to the halving events. Price return metrics may change based on whether the analysis looks at periods starting (and ending) 30, 60, 90, or 120 days from the halving date. Thus, using different windows may affect the conclusions drawn from past price performance. For our purposes, we use a 60-day period, as it helps filter out short-term noise while being close enough to the halving that other market factors may begin to dominate price drivers in the long term.
ETF: The Key to Success is to Start
The U.S. spot Bitcoin ETF is reshaping Bitcoin's market dynamics by establishing a new anchor point for Bitcoin demand. In previous cycles, liquidity was a major obstacle to upward price momentum, as major market participants (including but not limited to Bitcoin miners) would push sell-offs when trying to exit long positions.
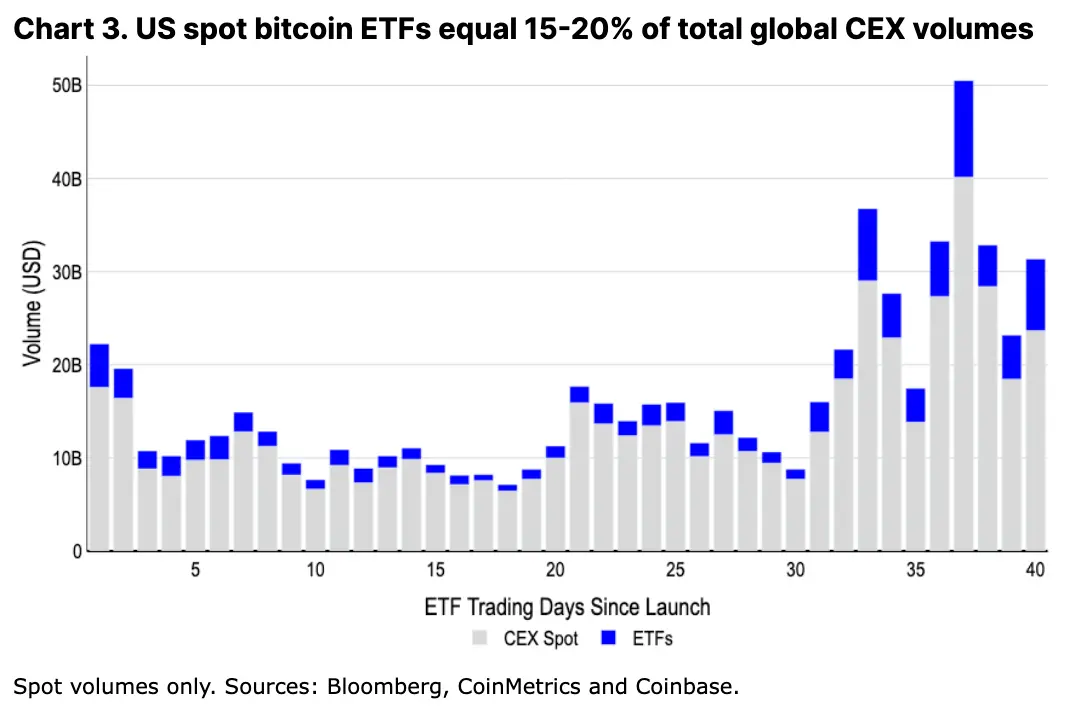
Today, ETF inflows are expected to absorb most of the supply in a gradual and sustained manner. In fact, the average daily BTC spot trading volume of ETFs is now around $4-5 billion, accounting for 15-20% of the total trading volume on global centralized exchanges, providing sufficient liquidity for institutions to trade in this space. In the long run, this stable demand situation may positively impact Bitcoin's price, as it creates a more balanced market with less volatility from concentrated sell-offs.
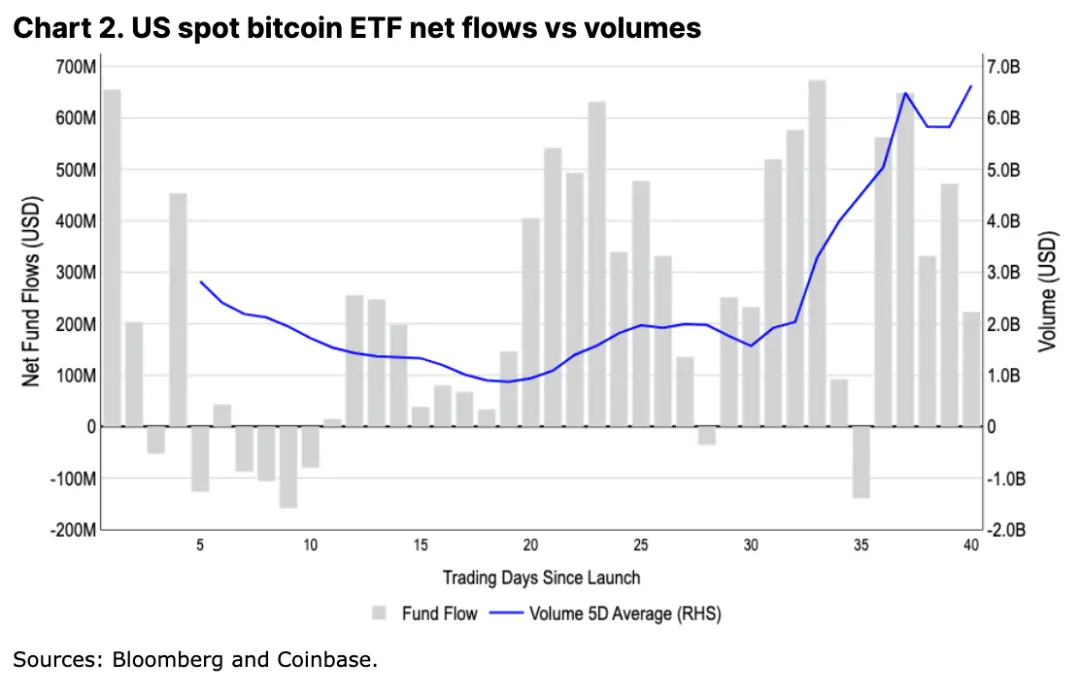
The U.S. spot Bitcoin ETF has already attracted $9.6 billion in net inflows over the past two months, with total assets under management reaching $55 billion. This means that during this period, the cumulative net increase of BTC held by these ETFs (180,000 coins) is nearly three times higher than the 55,000 new Bitcoins produced by miners (see Figure 3). According to Bloomberg, if we look at all spot Bitcoin ETFs globally, these regulated investment vehicles currently hold about 1.1 million Bitcoins, accounting for 5.8% of the total circulating supply.
In the medium term, we may see ETFs continue to maintain or even increase current liquidity, as large brokerages have yet to start offering these products to clients. With over $6 trillion still in U.S. money market funds and upcoming interest rate cuts, we believe there is a significant amount of idle capital available to enter this asset class this year.
By the way, it is important to note that the potential centralization issues of Bitcoin held by ETFs do not pose a stability risk to the network, as merely holding Bitcoin does not affect the decentralization of the network or control its nodes. Additionally, financial institutions currently cannot offer derivatives based on these ETFs (as underlying assets), and once these derivatives become available, they may change the market structure for large participants. However, regulatory approval for this is conservatively estimated to take several months.
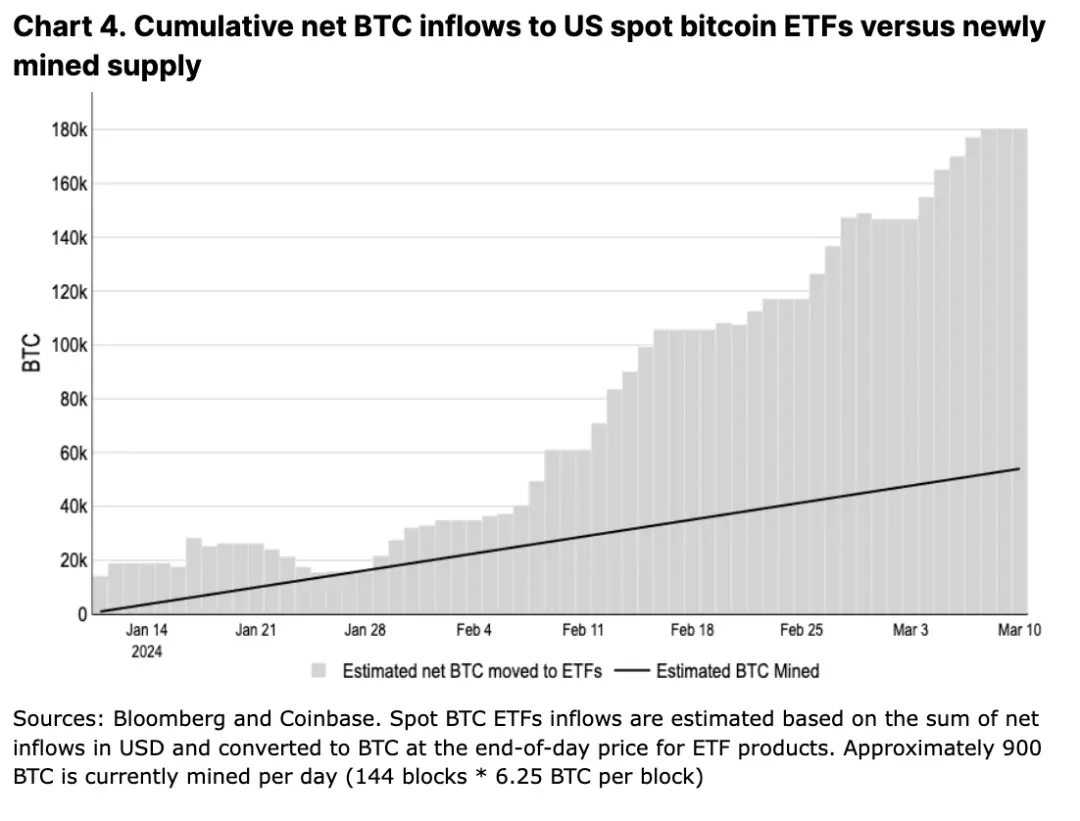
Assuming that the inflow rate of U.S.-based ETFs slows from $6 billion in February to a steady state of $1 billion per month, a simple psychological model suggests that Bitcoin's average price should be close to $74,000 relative to the approximately 13,500 BTC mined monthly (post-halving). Of course, one obvious issue with this model is that Bitcoin miners are not the only source of Bitcoin supply being sold in the market. In fact, we believe that the imbalance between newly mined Bitcoins and ETF inflows is just a small part of the long-term cyclical supply trend.
Lies, Damn Lies, and Statistics
One way to measure the supply of Bitcoin available for trading is to take the difference between the following two: (1) the current circulating supply (19.65 million BTC); (2) the illiquid supply, which consists of Bitcoins that are essentially not traded due to lost wallets, long-term holding, or being locked in other ways. According to Glassnode's data, which classifies illiquid supply based on cumulative inflows and outflows over a given entity's lifecycle, the level of available Bitcoin supply has been on a downward trend over the past four years, dropping from a peak of 5.3 million BTC in early 2020 to the current 4.6 million. This marks a significant shift compared to the steady increase in available supply observed during the previous three halving periods (see Figure 5).
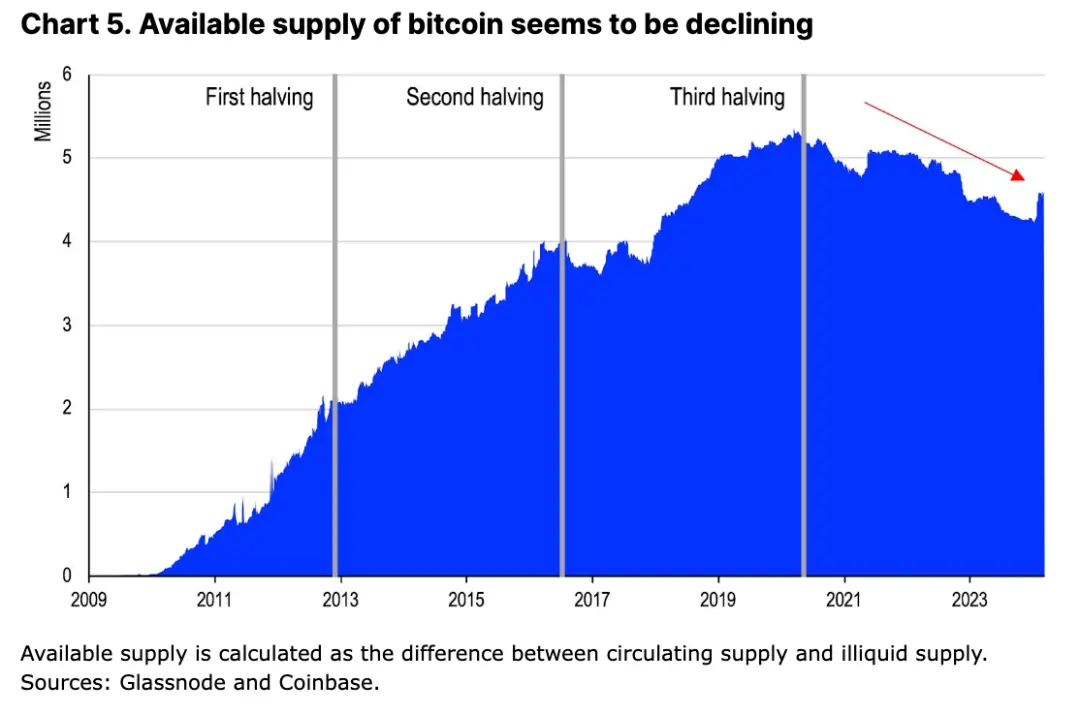
At first glance, the decline in Bitcoin's trading availability seems to be one of the main technical supports for Bitcoin's performance, as we have new institutional demand from ETFs. However, considering that the new Bitcoins entering circulation are about to decrease, these supply-demand dynamics suggest that the likelihood of market tightening in the short term may be high. That said, we believe this framework does not fully capture the complexity of Bitcoin market liquidity dynamics, especially since "illiquid supply" does not mean static supply.
We believe that investors should not overlook several key factors that may influence selling pressure:
- Not all Bitcoins in illiquid conditions are "trapped." Compared to short-term holders, long-term holders (those holding Bitcoin for over 155 days, accounting for 83.5% of holdings) may be less economically sensitive to their positions than short-term holders, but we expect that some in this group may still realize profits when prices rise.
- Some holders may not intend to sell in the near future but can still provide liquidity by using their Bitcoins as collateral. This also somewhat affects the "illiquidity" attribute of these Bitcoins.
- Miners may sell their Bitcoin reserves (currently totaling 1.8 million BTC for public and private miners) to expand their operations or cover other costs.
- A short-term holding amount of around 3 million BTC is not insignificant, and as prices fluctuate, speculators may still profit from exiting.
Ignoring these meaningful sources of supply, the notion of inevitable scarcity due to reduced mining rewards and stable ETF demand is overly simplistic. In our view, a more comprehensive assessment is needed to determine the true supply-demand dynamics behind the upcoming halving event.
Active Supply and Flow
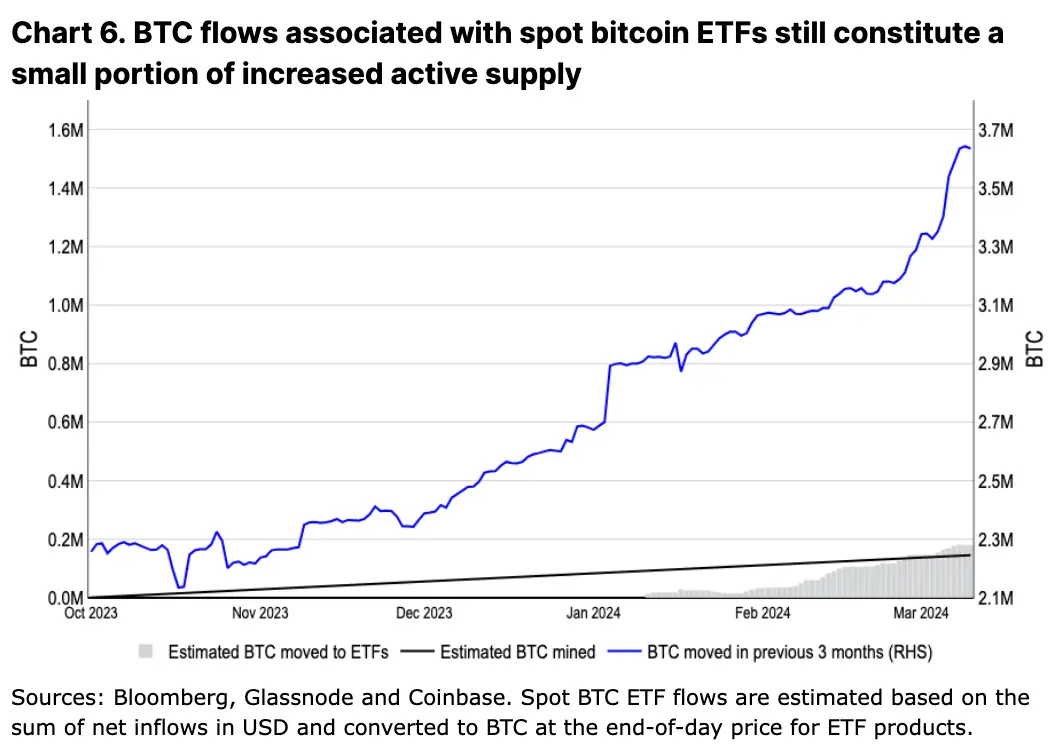
Even with Bitcoin being included in ETFs, the growth rate of the active circulating supply (defined as Bitcoins that have moved in the past three months) has significantly outpaced the cumulative inflow of ETFs (see Figure 6). Since the beginning of Q4 2023, the active BTC supply has increased by 1.3 million, while only about 150,000 new Bitcoins have been mined.
Some of this active supply indeed comes from miners themselves, who may be selling reserves both to capitalize on price movements and to establish liquidity in the face of reduced income. We discussed this in more depth in our previous report "Bitcoin Halving and Miner Economics" published on January 30. This is similar to miners' behavior in previous cycles. However, Glassnode reports that from October 1, 2023, to March 11, 2024, the net balance of miners' wallets has only decreased by 20,471 Bitcoins, indicating that the newly active Bitcoin supply mainly comes from elsewhere.
In previous cycles, changes in active supply outpaced the growth of newly mined Bitcoins by more than five times. During the 2017 and 2021 cycles, active supply nearly doubled, increasing from a low of 6.1 million (an increase of 3.2 million) over 11 months, and from 3.1 million to 5.4 million (an increase of 2.3 million) over 7 months, respectively. In contrast, the amount of Bitcoin mined during the same periods was approximately 600,000 and 200,000.
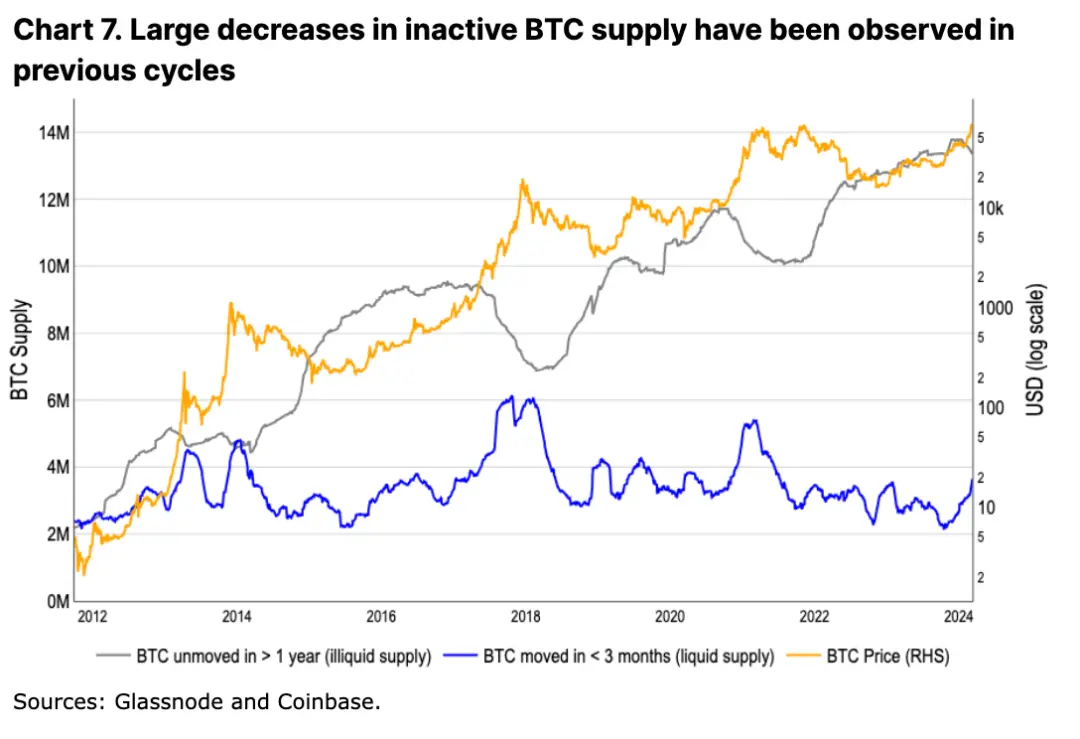
Meanwhile, in this cycle, the inactive supply of Bitcoin (defined as Bitcoins that have not moved for over a year) has also declined for three consecutive months, which may indicate that long-term holders are beginning to sell (see Figure 7). Normally, this would be interpreted as a mid-cycle sign. In the aforementioned 2017 and 2021 cycles, there was about a one-year time frame from when inactive supply peaked to the highest price moments of those cycles, specifically 12 months and 13 months. The current cycle's inactive Bitcoin count seems to have peaked in December 2023.
However, it remains unclear what proportion of these Bitcoins have been transferred to exchanges (for sale), locked in cross-chain bridges, or otherwise used for financial transactions (e.g., over-the-counter trading). According to Glassnode's data, although Bitcoin inflows to exchanges have doubled this year, the net balance of Bitcoin on exchanges has decreased by 80,000. This indicates that, aside from ETFs, other pools of capital are helping to offset the increase in transfers from long-term and short-term holders to exchanges.
In fact, the supply-demand dynamics in the spot market only capture part of the story of capital inflows and outflows. Bitcoin exhibits a derivative multiplier effect similar to commodities, where the nominal value of outstanding Bitcoin derivatives is significantly higher than the market value of physical Bitcoins. Since the Bitcoin derivatives market amplifies spot trading volumes several times, analyzing only public trading data from spot exchanges does not fully reflect the true liquidity and adoption situation in the Bitcoin economy.
Therefore, while the increased activity of "dormant" Bitcoins aligns with previous bull market peaks, we believe that the exact dynamics of how supply and demand interact in the current environment remain uncertain.
Conclusion
This cycle may indeed be different. The ongoing daily net inflows into U.S. spot Bitcoin ETFs will continue to be a significant tailwind for this asset class. As the supply of newly mined Bitcoins is about to be halved, this will lead to tighter market dynamics. However, this does not necessarily mean we are entering a situation of supply scarcity, where demand will exceed selling pressure. What is clear is that Bitcoin spot ETFs have officially become a new category of digital assets, and mainstream financial institutions can now incorporate them into traditional portfolios, marking an important milestone in Bitcoin's mainstream adoption. Thus, we believe that the current price trend is just the beginning of a long-term bull market, needing further price appreciation to push the supply-demand dynamics toward equilibrium.
 Risk warning
 Risk warning