11 charts interpreting the mixed performance of the August cryptocurrency market
Summary:
For the cryptocurrency industry, the past August was a month of mixed results. This article will interpret the state of the cryptocurrency market over the past month with 11 charts.

2024-09-02 23:43:58
Collection
 For the cryptocurrency industry, the past August was a month of mixed results. This article will interpret the state of the cryptocurrency market over the past month with 11 charts.
Author: Lars, Head of Research at The Block
Compiled by: Jordan, PANews
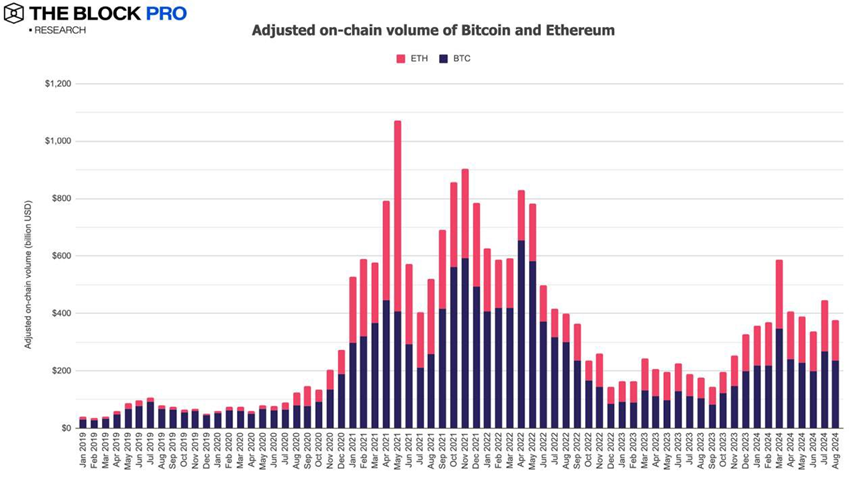
- In August, the total on-chain transaction volume for Bitcoin and Ethereum decreased by 15.3% after adjustments, falling to $377 billion, with Bitcoin's adjusted on-chain transaction volume dropping by 12.1% and Ethereum's by 20.2%.
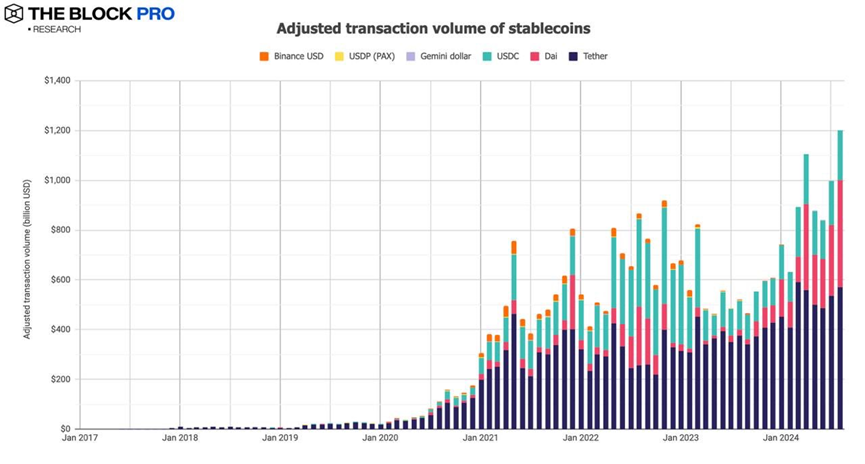
- The adjusted on-chain transaction volume for stablecoins in August grew by 20.5%, reaching $1.2 trillion, while the supply of stablecoins increased by 2.9% to $148.4 billion, with USDT and USDC holding market shares of 78.7% and 17.4%, respectively.
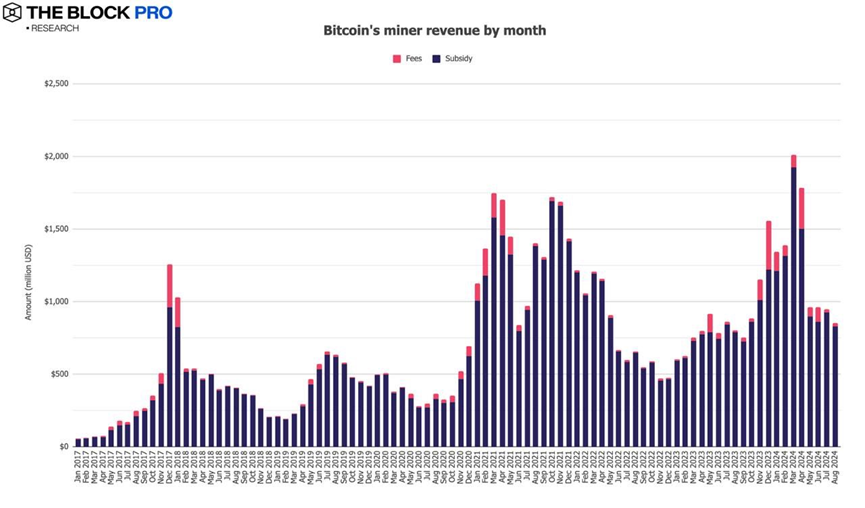
- Bitcoin miner revenue reached $851.4 million in August, a decline of 10.4%. Additionally, Ethereum staking revenue also fell by 19.3%, dropping to $218.2 million.
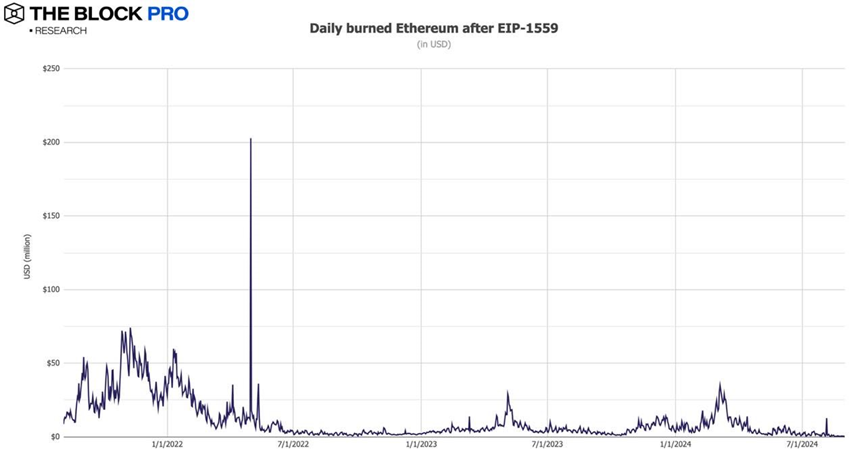
- In August, the Ethereum network burned a total of 13,467 ETH, worth approximately $34.9 million. Data shows that since the implementation of EIP-1559 in early August 2021, Ethereum has burned a total of about 4.37 million ETH, valued at around $12.3 billion.
- The on-chain NFT market for Ethereum continued its downward trend in August, with a decline of 12.8%, further dropping to approximately $123.2 million.
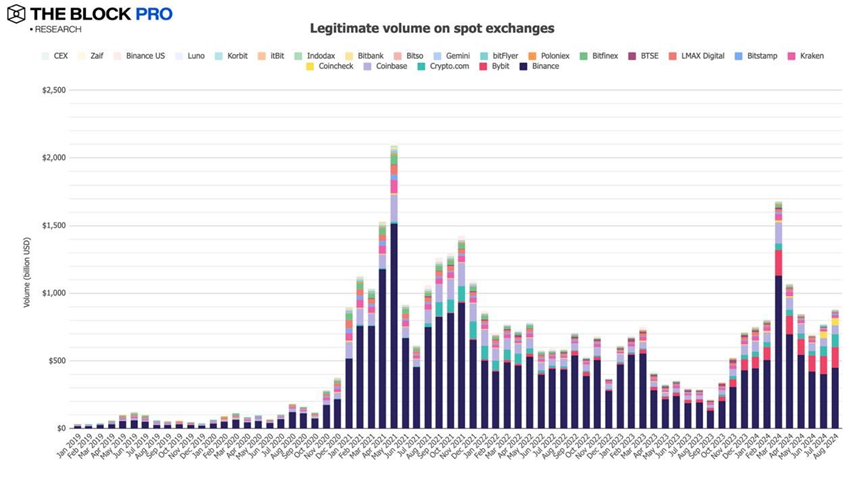
- The spot trading volume of compliant centralized exchanges (CEX) increased in August, rising by 13.7% to $877.5 billion.
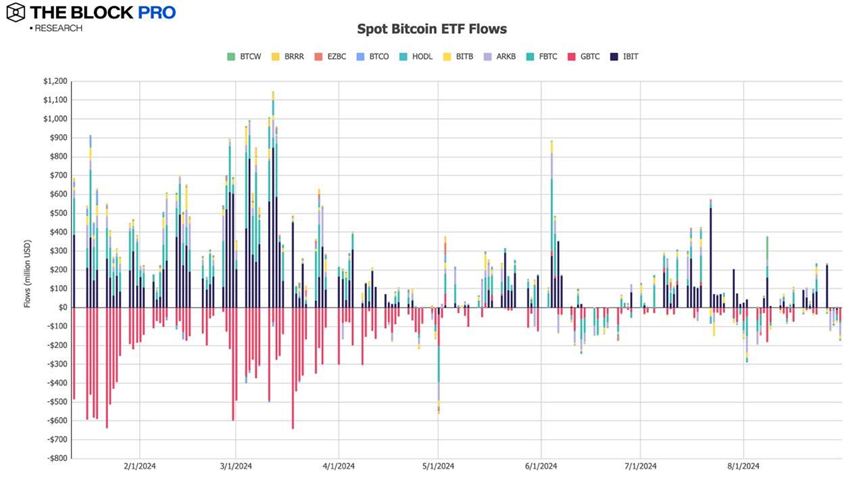
- In August, the net inflow of spot Bitcoin ETFs experienced negative growth, with an outflow amount of approximately $422.1 million.
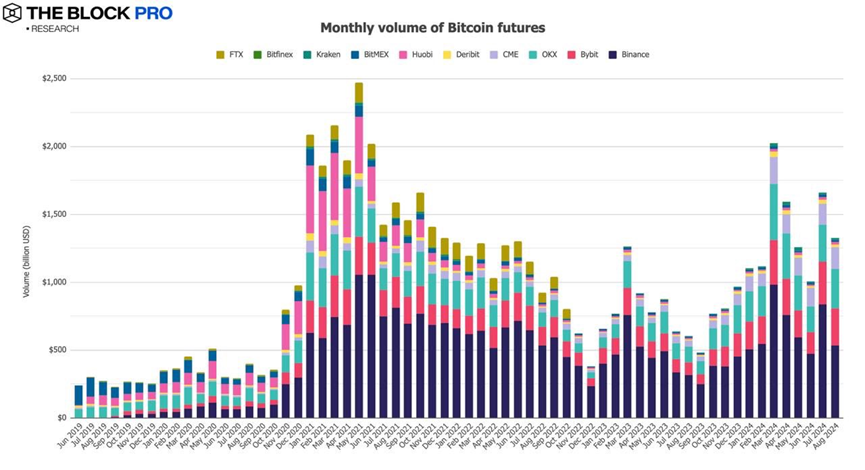
- In terms of cryptocurrency futures, the open interest for Bitcoin futures fell by 17.9% in August; Ethereum futures open interest decreased by 28.6%. Regarding trading volume, Bitcoin futures trading volume in August dropped by 20.2% to $1.33 trillion, while Ethereum futures trading volume declined by 22.2%.
- In August, the open interest for Bitcoin futures on the Chicago Mercantile Exchange decreased by 15.3%, falling to $9 billion, with the daily average volume declining by 0.2% to approximately $5.04 billion.
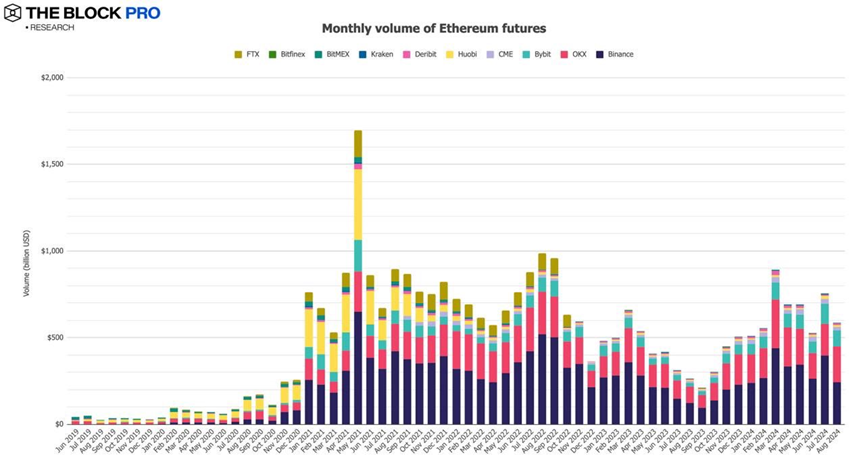
- The average monthly trading volume for Ethereum futures in August decreased by $58.75 billion, a decline of 22.2%.
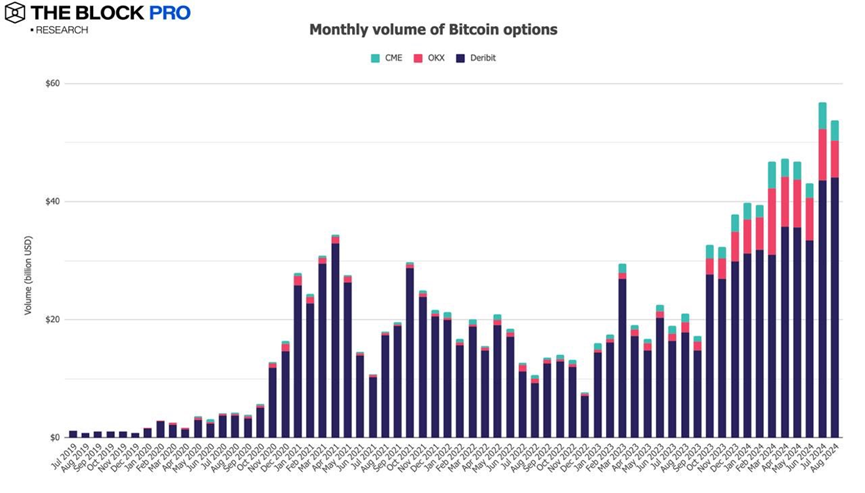
- In the cryptocurrency options market, the open interest for Bitcoin options fell by 3.8%, while Ethereum options open interest also declined by 13.9%. Additionally, in terms of trading volume, Bitcoin monthly options trading volume reached $53.8 billion, down by 5.4%; Ethereum options trading volume was $15.5 billion, remaining roughly stable compared to the previous month.


 Risk warning
Related tags
Risk warning
Related reading

A Perspective on the Indian Cryptocurrency Market: Descending into Silence or Moving Towards Maturity?
9時間前
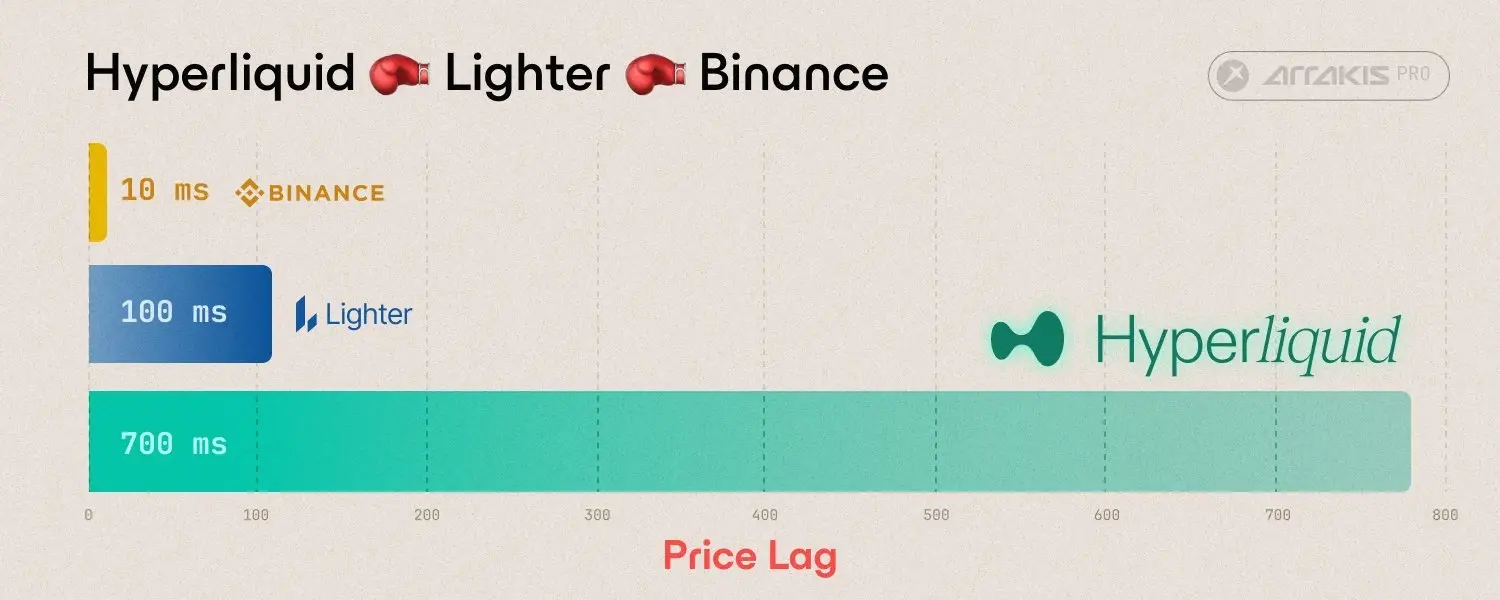
Who is leading the price discovery in the cryptocurrency market? Measured delays on platforms like Binance and Hyperliquid
1日前

Daily Observation of Cryptocurrency Concept Stocks: BTC Drops to $61,300 - Charles Schwab Analyst's "Momentum Loss" Theory is More Worrisome than Saylor's AI Rotation Argument
2日前