CoreWeave plummets 15%: Bonds gave a heads-up a month earlier, how will things develop next?

 The price changes in the credit market usually lead those in the stock market. Understanding the timeline of bonds provides an additional leading indicator for judging the direction of these types of stocks.
Introduction: First, let's answer a question that readers are likely to ask: Is the CoreWeave bond issue something that just happened? The answer is no—warnings from the bond market have been sounding for over a month, and the stock price only began to plummet yesterday. This time lag is precisely the focus of this article: changes in credit market prices typically precede those in stocks. Understanding the timeline of bonds provides an early reading for judging the direction of such stocks.
1. Timeline: From Smooth Bond Issuance in April to Crisis Pricing in October
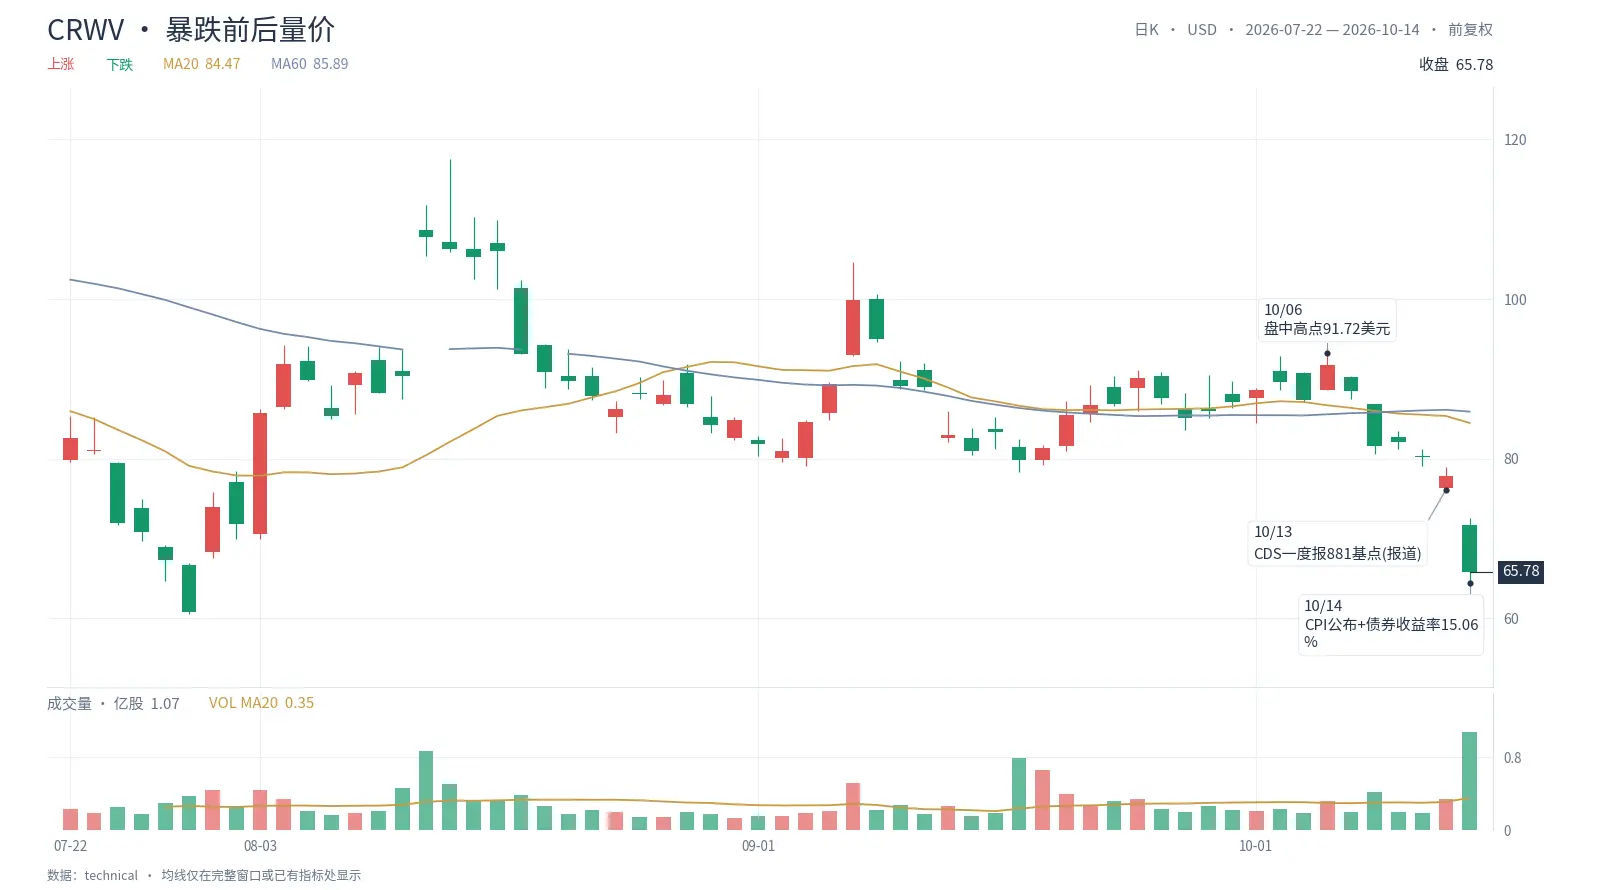
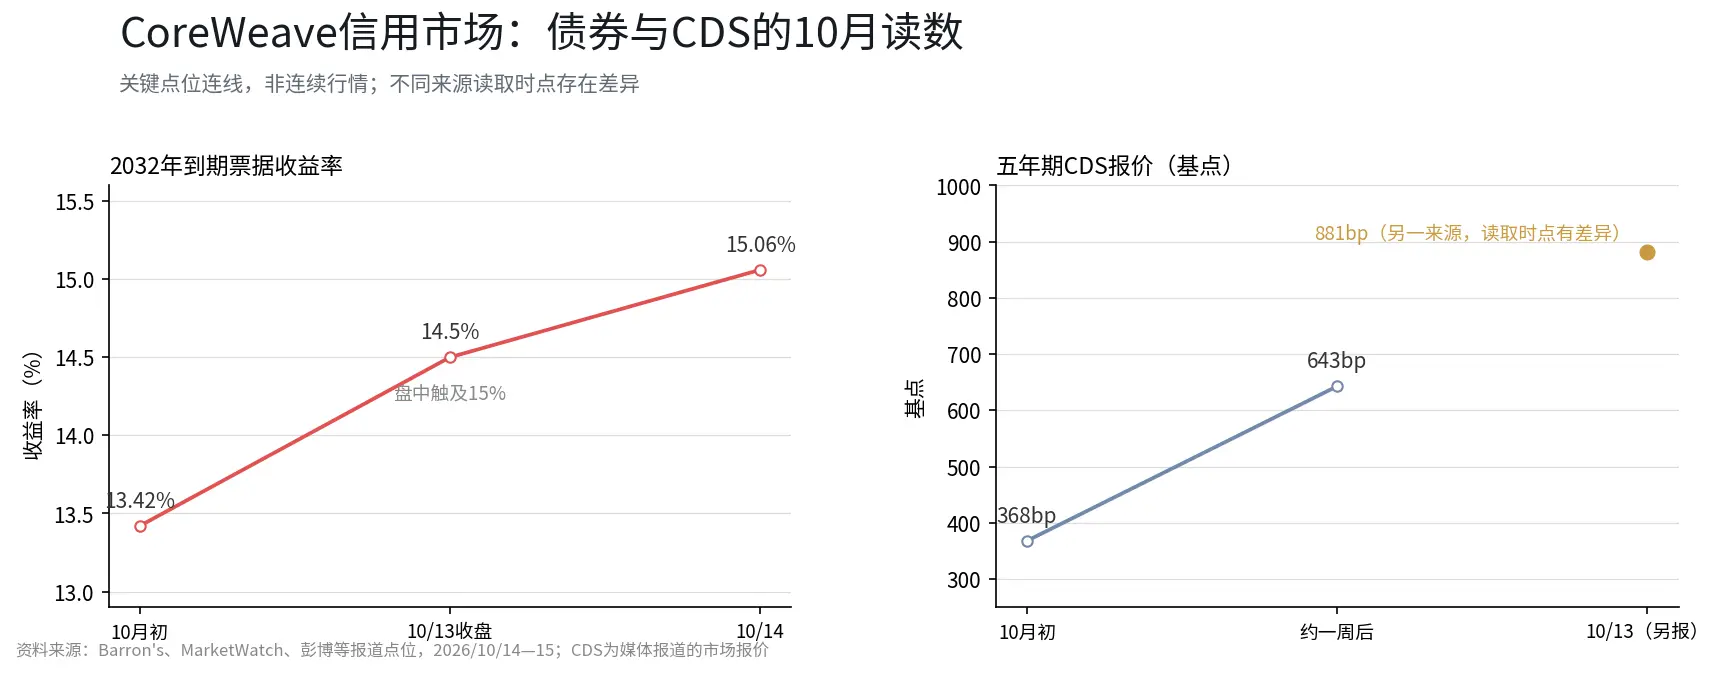
Let's line up events over the past few months. In April of this year, CoreWeave issued $2.75 billion in bonds with a coupon rate of 9.75%, maturing in 2031, and expanded the issuance scale—at that time, investors were still willing to lend money to it. Subsequently (according to Bloomberg, about four months ago), it issued $1.25 billion in notes at face value with a coupon rate of 9.625%, maturing in 2032. By October, the situation changed: the yield on the 2032 notes rose sharply from 13.42% at the beginning of the month; on October 13 (Tuesday), it hit a historical high of 15% during trading, closing at 14.5%. A well-known investor shared a yield chart on social media, which was then reposted and commented on as "scary" by people in the tech industry. On October 14 (Wednesday), the same day the CPI data was released and tech stocks plummeted, bond prices fell to 78-81 cents, and the yield on the 2032 notes rose to 15.06%, with the stock price dropping 15.29% in a single day, closing at $65.78.
Changes in credit default swaps (CDS) were similarly rapid: according to market statistics, the five-year CDS quotes rose from about 368 basis points to about 643 basis points within October (almost doubling in a week), with reports indicating that on Monday (October 13), it briefly reached about 881 basis points—there are discrepancies in the timing of readings from different sources, but the direction is consistent: the market is demanding a higher price for CoreWeave's default risk. The company's response included two points: management emphasized in an internal letter to employees that there are ample orders, while publicly stating that the market reaction is "irrational" and that the business model is robust (according to reports from Reuters and others).
2. What Bonds Said Before Stock Prices Dropped
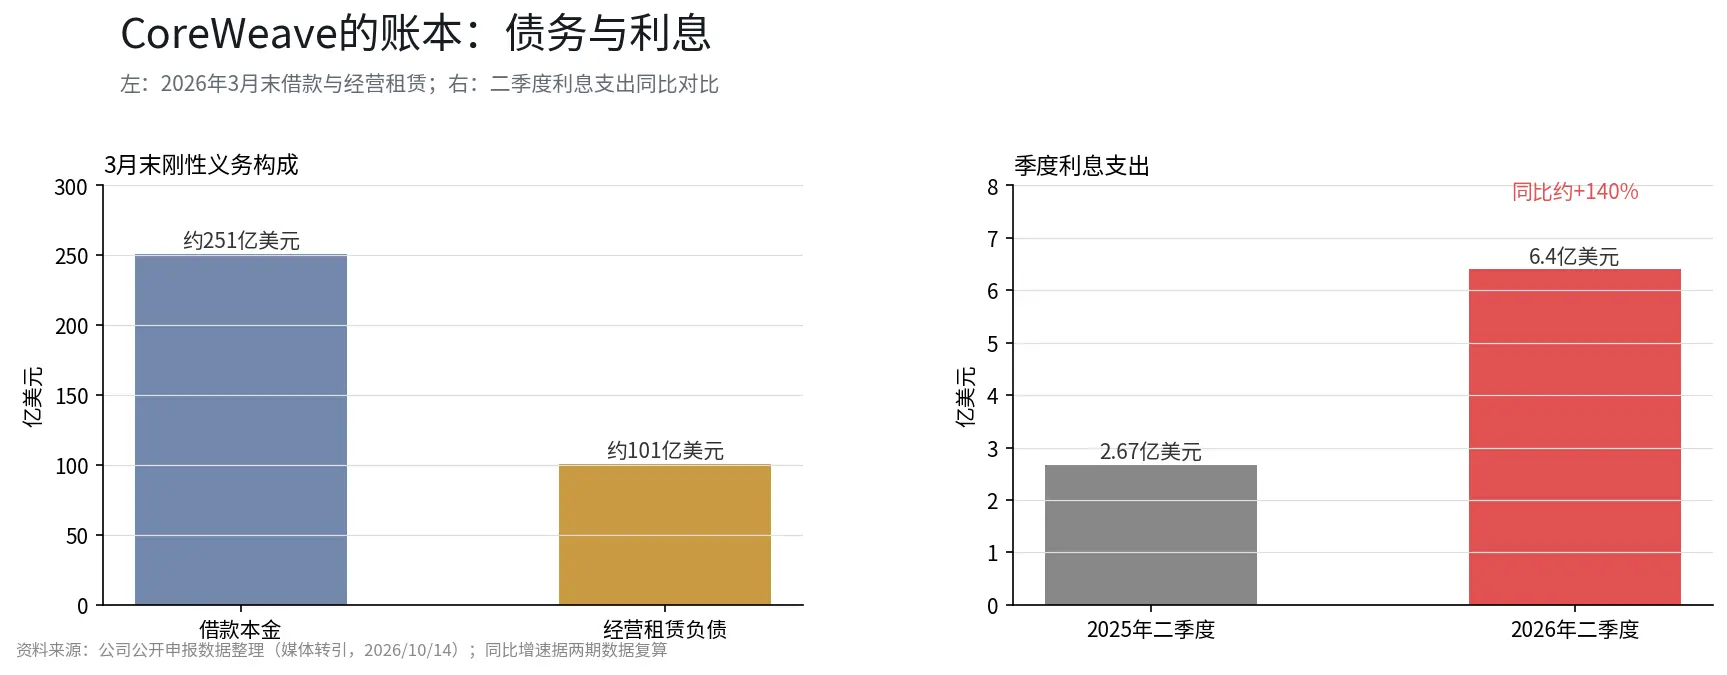
Why did bonds drop first and stocks follow? Because the pricing objects for the two are different. Stock prices are based on expectations of revenue growth, while bond prices are based on the more immediate question of whether "cash flow can cover interest." Let's lay out CoreWeave's financials: according to publicly disclosed data, as of the end of March, the principal of loans was about $25.1 billion, and operating lease liabilities were about $10.1 billion, totaling about $40.7 billion in rigid obligations; second-quarter interest expenses were $640 million, which is 2.4 times that of the same period last year; according to Barron's, its free cash flow for 2026 is expected to be about -$27 billion, with the gap filled by continued bond issuance. This model of "borrowing money to buy chips and renting chips to generate cash" becomes more expensive at each step as interest rates rise—the higher the new bond rates, the larger the gap, which is the logic of fixed income versus variable interest.
What does a bond yield rising to 15% mean? Simply put, the market now demands an annualized return of 15% to continue lending money to CoreWeave, whereas four months ago, it could borrow at face value with a coupon rate of about 9.6%. The increase in financing costs will directly compress the feasibility of all future capital expenditures for the company—this is the warning the bond market provided before the stock price dropped.
3. How to Read Such Stocks: A Transmission Sequence and an Observation Checklist
The global decline in AI-related assets yesterday generally followed a transmission sequence: bond prices dropped first (CoreWeave notes at 78 cents); the stocks of high-leverage computing companies followed (CoreWeave down 15%); heavy capital supply chains were then pressured (GE Vernova down 8%, Vertiv down 6.8%, Caterpillar down 3.5%, Dell down 11%, and some institutions downgraded the ratings of the three major server manufacturers on the same day, according to media reports); and the bonds of the giants lagged behind (Oracle's 2033 maturing bonds hit a new low, and Meta's long-term bonds fell about 20% from the issuance price). It is worth noting that as of the time of writing, there has been no public evidence of actual order cuts or project terminations—the impact is primarily on expectations and financing conditions, not on orders.
For readers concerned about such assets, five specific observation points are more useful than "should we panic":
First, focus on bonds rather than stock prices. Whether the yield on CoreWeave's 2031/2032 notes can fall back below 13%, whether the CDS can narrow back below 400 basis points, and whether bond prices can recover to 80 cents—if these three readings improve, it indicates that the market is willing to lend money again, with sentiment explanations prevailing; if they continue to widen, financing constraints will dominate the explanation.
Second, monitor the refinancing calendar. In the coming weeks, whether CoreWeave and similar entities have new issuances, and how they are priced. Successful issuance at controllable costs means the market is personally voting against the "crisis" narrative; delays or failures in issuance would be direct evidence of financing constraints.
Third, compare two numbers in the third-quarter report. The revenue and the realization of orders on hand, compared to the year-on-year growth rate of interest expenses—second-quarter interest expenses have already increased by about 140% year-on-year. If revenue outpaces interest, the model holds; if interest outpaces revenue, pressure escalates.
Fourth, technical levels only describe the state. The stock price of $65.78 has fallen below the 20-day moving average ($84.47) and the 60-day moving average ($85.89), with a 14-day RSI reading of about 22, indicating a historically significant deep oversold area; the 52-week low of $60.55 and the intraday low of $64.41 on Wednesday are the two most recent reference points. Additionally, according to market data aggregation, analysts' average 12-month target price is about $141, and the distance from the market price itself measures the degree of divergence (according to reports, this view only represents the judgment of relevant institutions). These are observation coordinates and do not constitute predictions for future trends.
Fifth, self-check the correlation of holdings. The entities affected in this round share a common label: they have borrowed heavily for AI infrastructure, with negative free cash flow. Conversely, companies in the application and model layers with positive subscription revenue and healthy cash flow (such as Anthropic, which disclosed data yesterday, see another article on the same day) have not been caught up in the same issue. To judge whether you are affected, first look at whether the companies in your holdings are expanding through borrowing or through cash.
4. Future Developments: Two Paths and Several Confirmation Points
Let's lay out the possibilities for the future in two scenarios, with the judgment materials coming from public readings (the following is a scenario outline and does not constitute predictions for trends):
One scenario is that sentiment-driven selling dominates, and the spread self-corrects. If the yield on the 2032 notes falls back from the 15% line, the five-year CDS narrows back below 500 basis points, and bond prices recover to 80 cents, and if there are successful new bond issuances in the coming weeks at acceptable pricing, then this round of sharp declines is closer to a sell-off driven by holdings and sentiment resonance—orders remain unchanged, interest remains unchanged, what changes is the price. Management's statement of "ample orders on hand," along with some institutions increasing their holdings during the sharp decline (according to media reports), are early signals of this scenario.
Another scenario is that financing constraints dominate, and cost pressures enter cash flow. If the spread continues to widen, refinancing is delayed or fails, and the growth rate of interest continues to significantly outpace revenue in the third-quarter report, then the issue shifts from "price" to "model": the arithmetic of borrowing money to buy chips becomes unsustainable during a rising interest rate period, and the heavy capital infrastructure layer may face stricter financing conditions overall. The reported "63% probability of default in five years" corresponds to extreme pricing in this scenario—this figure comes from model calculations and is highly sensitive to assumptions about recovery rates and cash flow paths, so it should be referenced but not treated as fact.
To determine which scenario we are in, continue to monitor the checklist from the third section: readings from bonds and CDS, the refinancing calendar, and the race between revenue and interest in the financial reports. There is also a side evidence worth tracking at the sector level: Dell fell over 11% yesterday, and some investment banks downgraded the ratings of server manufacturers on the same day. If the adjustment in the AI hardware chain remains at the valuation level, typically, differentiation and recovery can be seen within a few trading days; if it spreads to orders and guidance, the upcoming earnings season will provide answers.
Conclusion
The bond market moves first, and the stock market moves later; CoreWeave has merely demonstrated this old rule again. Orders have not disappeared, interest is becoming more expensive, and the race between the two determines the next phase of AI infrastructure stocks. For most readers, treating bond yields as an early reading for such stocks is more useful than chasing daily stock price fluctuations.
Disclaimer: The content of this article is for general information and market commentary purposes only, compiled based on publicly available information as of the time mentioned in the text. Relevant market data, expectations, and probabilities may change with market conditions. The views and investment strategies quoted from third-party institutions, analysts, or other individuals only represent the opinions of those third parties at a specific time and do not represent the views or recommendations of BIT. This article does not constitute investment advice, investment research, an invitation, solicitation, or recommendation for any securities, investment products, or trading strategies, nor should it be the basis for any investment decision. Financial markets carry risks, and securities prices and market performance may fluctuate; past performance and historical market trends do not represent or guarantee future results. Investors should independently assess relevant risks based on their own circumstances and seek professional advice when necessary. BIT's Hong Kong stock trading services are not provided to residents of Hong Kong or users in other restricted jurisdictions.
 Risk warning



Popular articles